One of the biggest challenges in modern marketing analytics is not collecting data.
It’s making the data usable.
While working at Billtrust, I developed a custom reporting framework inside Google Analytics 4 (GA4) that transformed fragmented marketing data into a centralized, executive-friendly decision-making system.
The goal was simple:
- Eliminate reporting fragmentation
- Reduce manual filtering and analysis
- Improve visibility into website lead generation
- Give marketing leadership self-serve reporting access
- Standardize performance measurement across teams
Instead of constantly digging through multiple sections of GA4 trying to piece together performance insights, our marketing team — including leadership and the CMO — could instantly access highly focused reporting dashboards tailored to our most important business objectives.
And importantly, we accomplished all of this directly inside GA4 without needing to rely on external BI tools like Looker Studio.
The Problem With Standard GA4 Reporting
GA4 is powerful, but out of the box it can quickly become difficult for marketing teams to navigate efficiently.
Some of the biggest challenges included:
- Reports spread across multiple navigation areas
- Constant filtering required
- Inconsistent report structures
- Difficulty isolating specific conversion types
- Limited executive-friendly reporting views
- Time-consuming manual analysis
For a global B2B SaaS organization like Billtrust, this became increasingly difficult as marketing initiatives scaled.
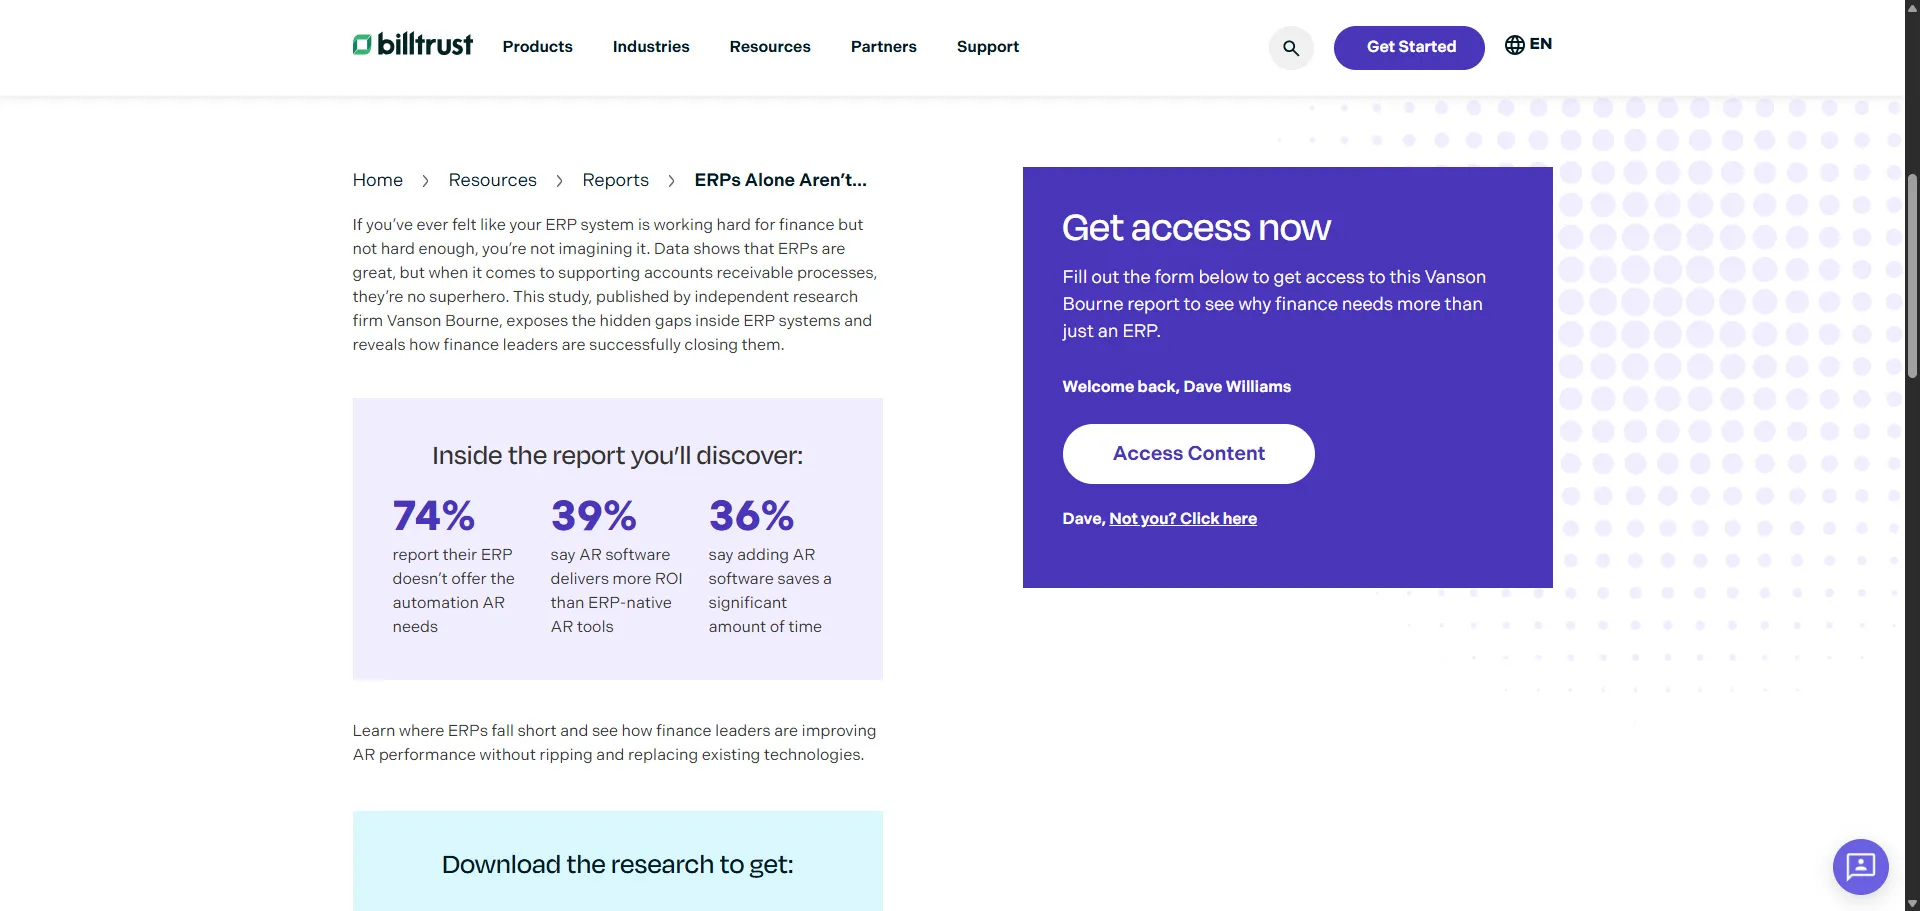
Our website served as a major lead generation engine powered heavily by Marketo forms, paid media campaigns, gated content, webinars, and product-focused content marketing.
We needed a reporting system built around how the business actually operated.
The Solution: Custom GA4 Dashboard Collections
To solve this, I architected a custom GA4 reporting structure using Collections and Topics.
In GA4, a collection is a group of reports that appears in the left navigation.
This allowed me to create a centralized analytics hub tailored specifically to our marketing organization.
The Dashboard Collection Structure
I created a custom GA4 Collection called:
DashboardsInside the collection, I created dedicated Topics for major marketing initiatives:
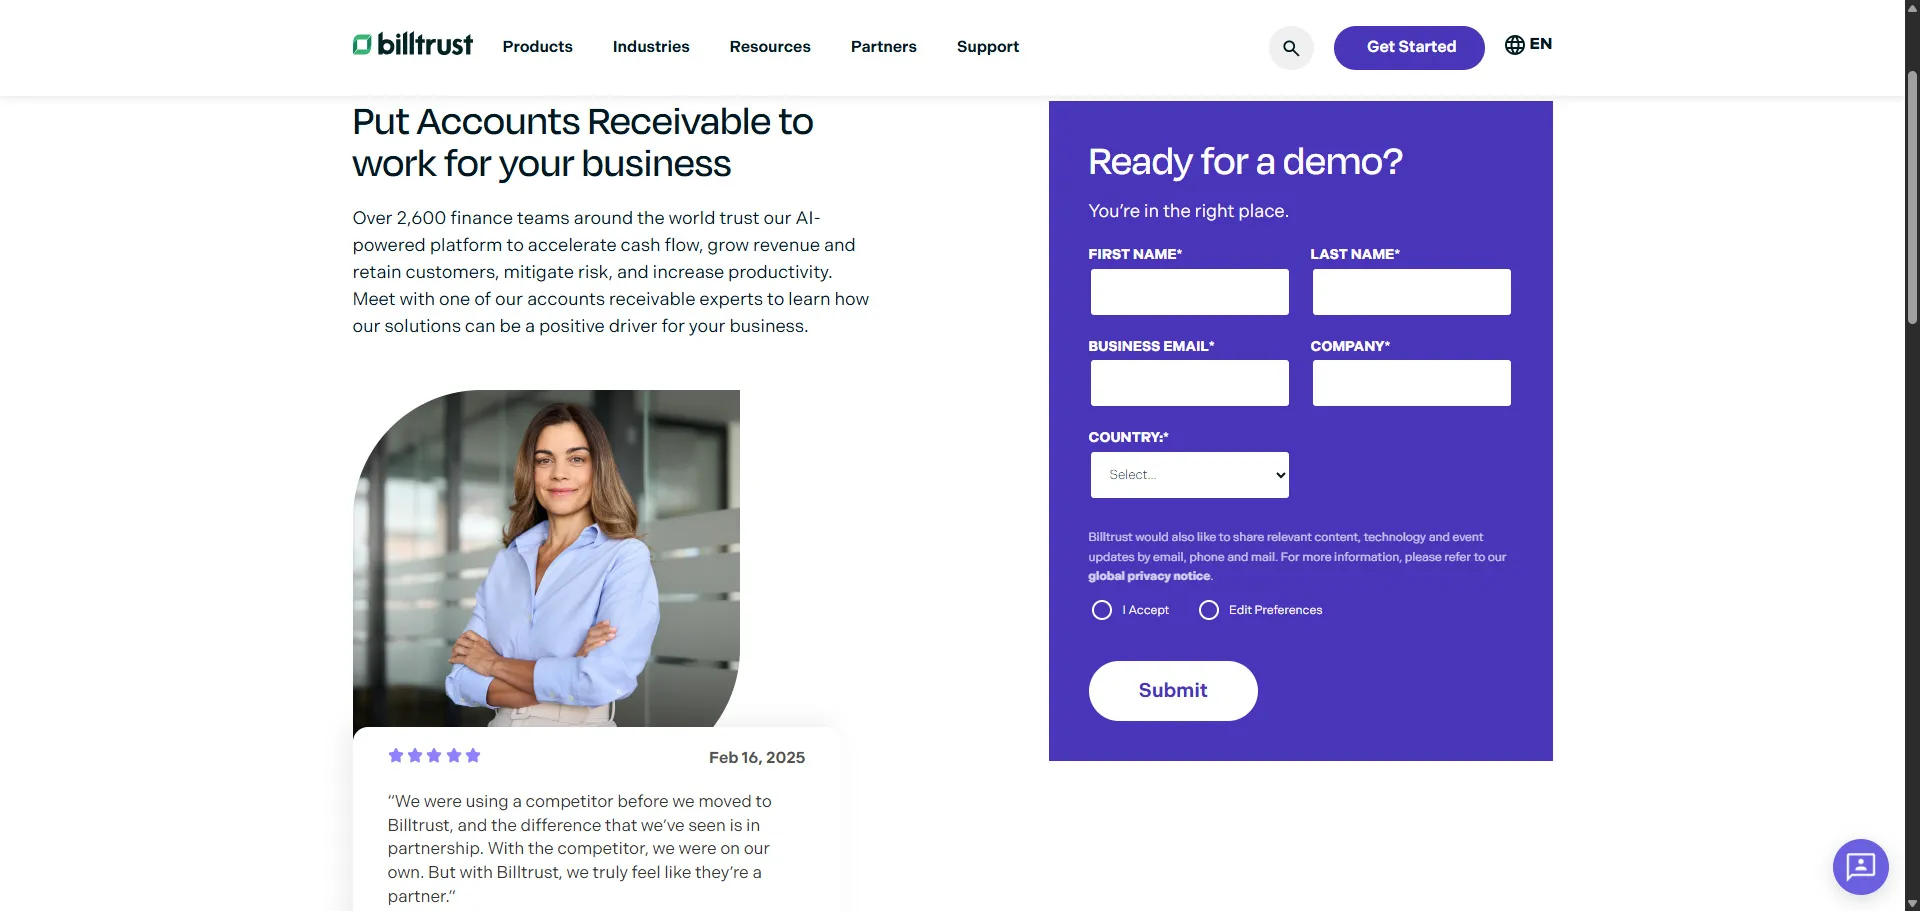
Contact Sales Conversions
Gated Content Conversions
Event Registration Conversions
Google Ads Conversions
Products / Industries / Resources
Each topic contained multiple focused reports designed around specific KPIs and marketing workflows.
This effectively turned GA4 into a purpose-built marketing analytics platform.
Why This Structure Worked
Instead of forcing users to manually search for data across GA4, the dashboards aligned directly with how the marketing team thought about performance:
- Lead generation
- Campaign attribution
- Content engagement
- Product interest
- Funnel optimization
- Paid media performance
This dramatically reduced friction for both tactical marketers and executives reviewing performance.
Standardizing the Reporting Framework
To maintain consistency across all dashboard topics, I created a standardized report structure.
Each conversion-focused topic included:
Form Conversion Overview
Form Lead Acquisition
Form Events
Form Events by Page
Form Events by Demographic
This gave every dashboard a predictable structure regardless of conversion type.
Users always knew where to find:
- Acquisition data
- Engagement data
- Geographic insights
- Form performance
- Content attribution
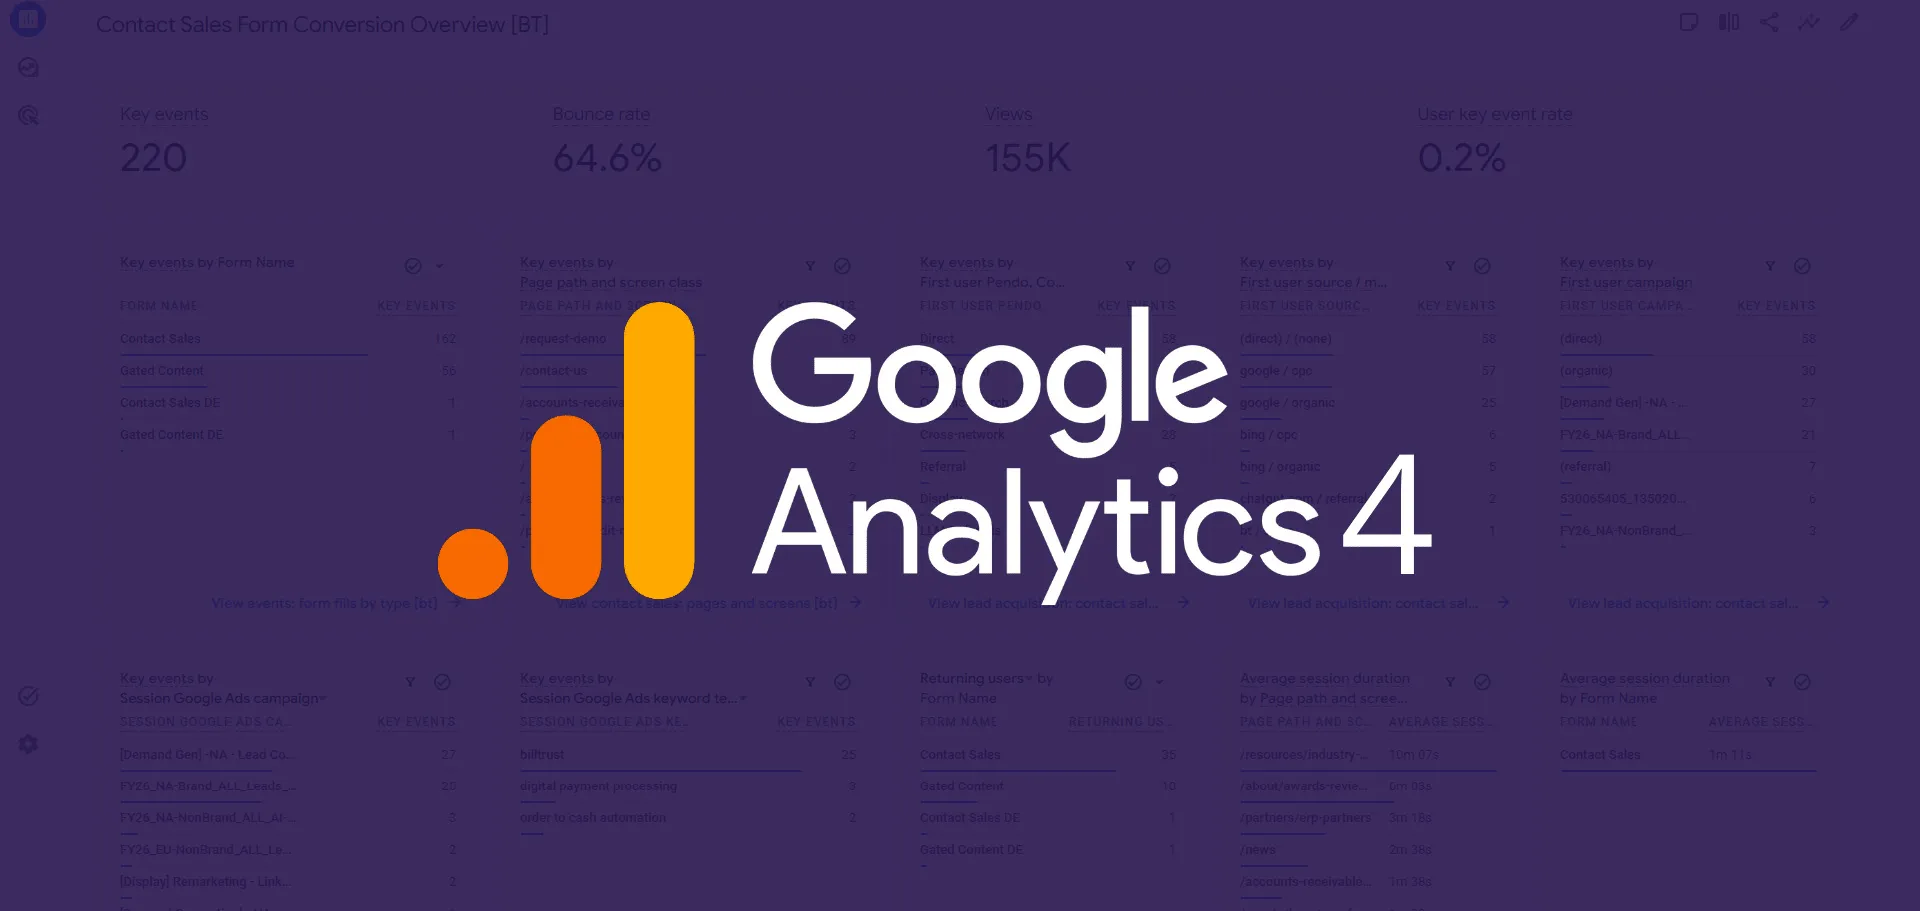
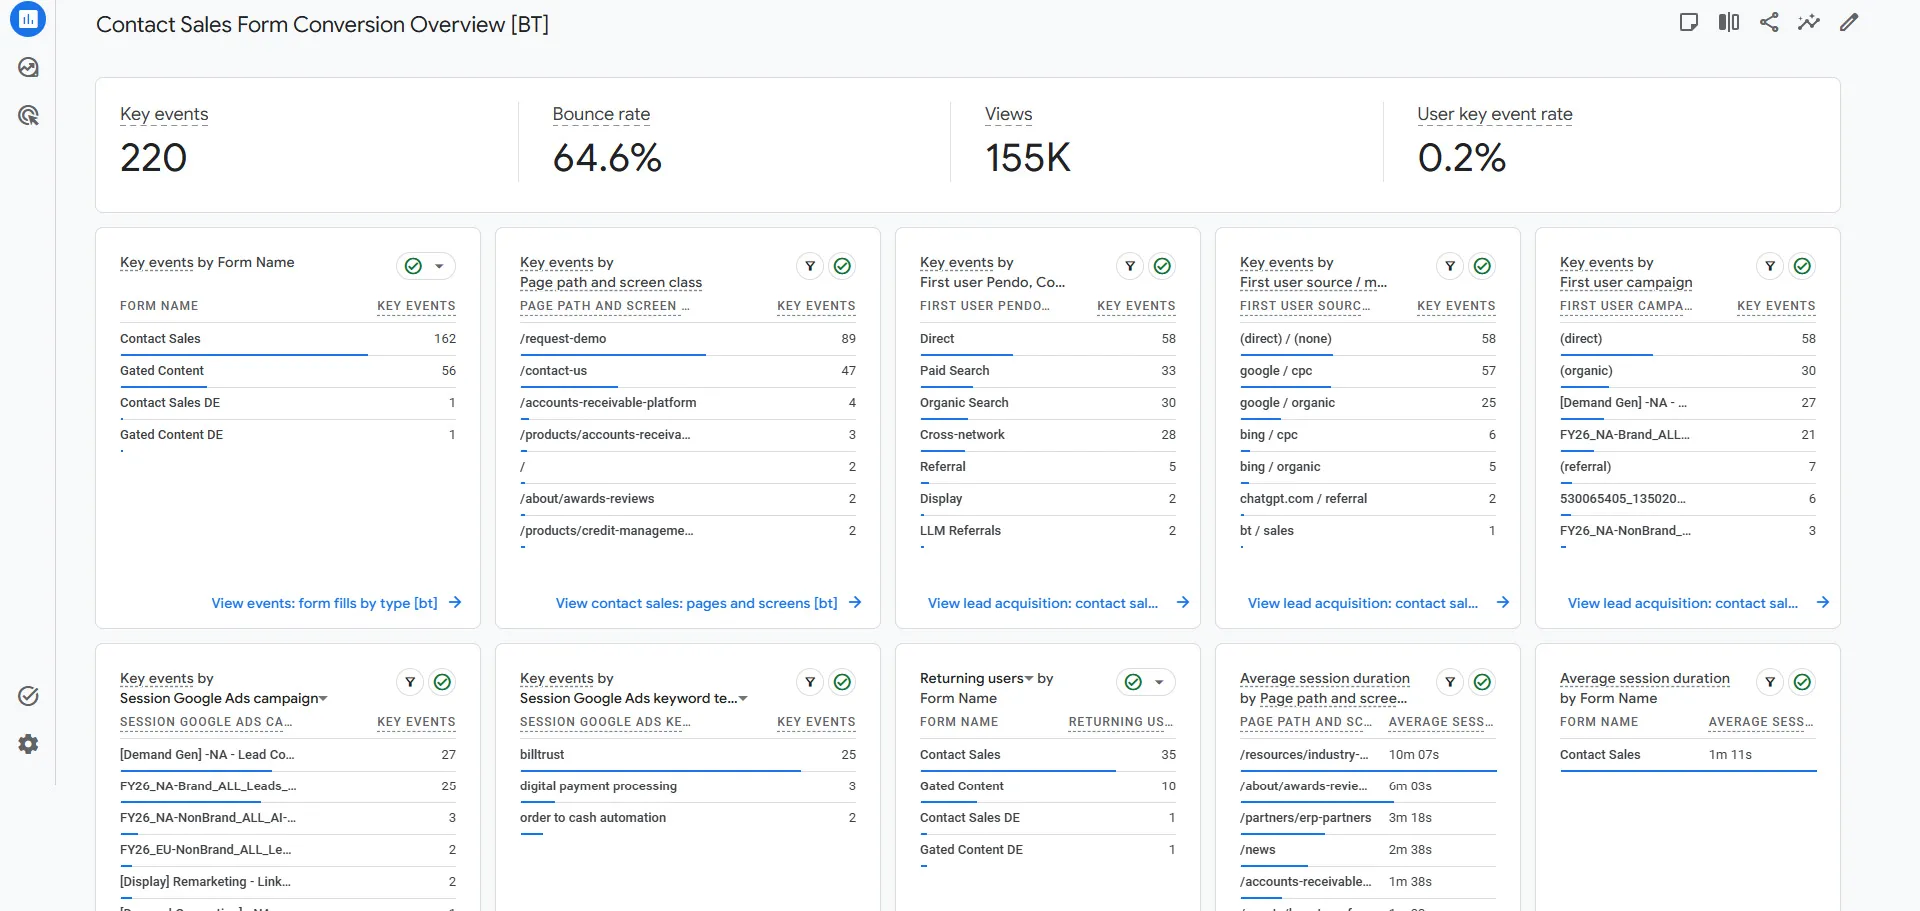
The Conversion Overview Report
The centerpiece of each dashboard topic was the Conversion Overview report.
This report consolidated the most important KPIs into a single executive-friendly view.
Each overview included cards for:
- Total key events by form name
- Key events by page path
- Key events by source
- Key events by source / medium
- Session Google Ads Campaign
- Session Google Ads Keyword Text
- Returning users by form name
- Average session duration
- Key events by region
- Key events by country
Each card was filtered specifically for the corresponding form category.
For example:
Contact Sales Conversion Overviewonly displayed data related to Contact Sales forms.
This filtering approach kept reports highly focused and eliminated reporting noise.
Building a Form-Naming System for GA4
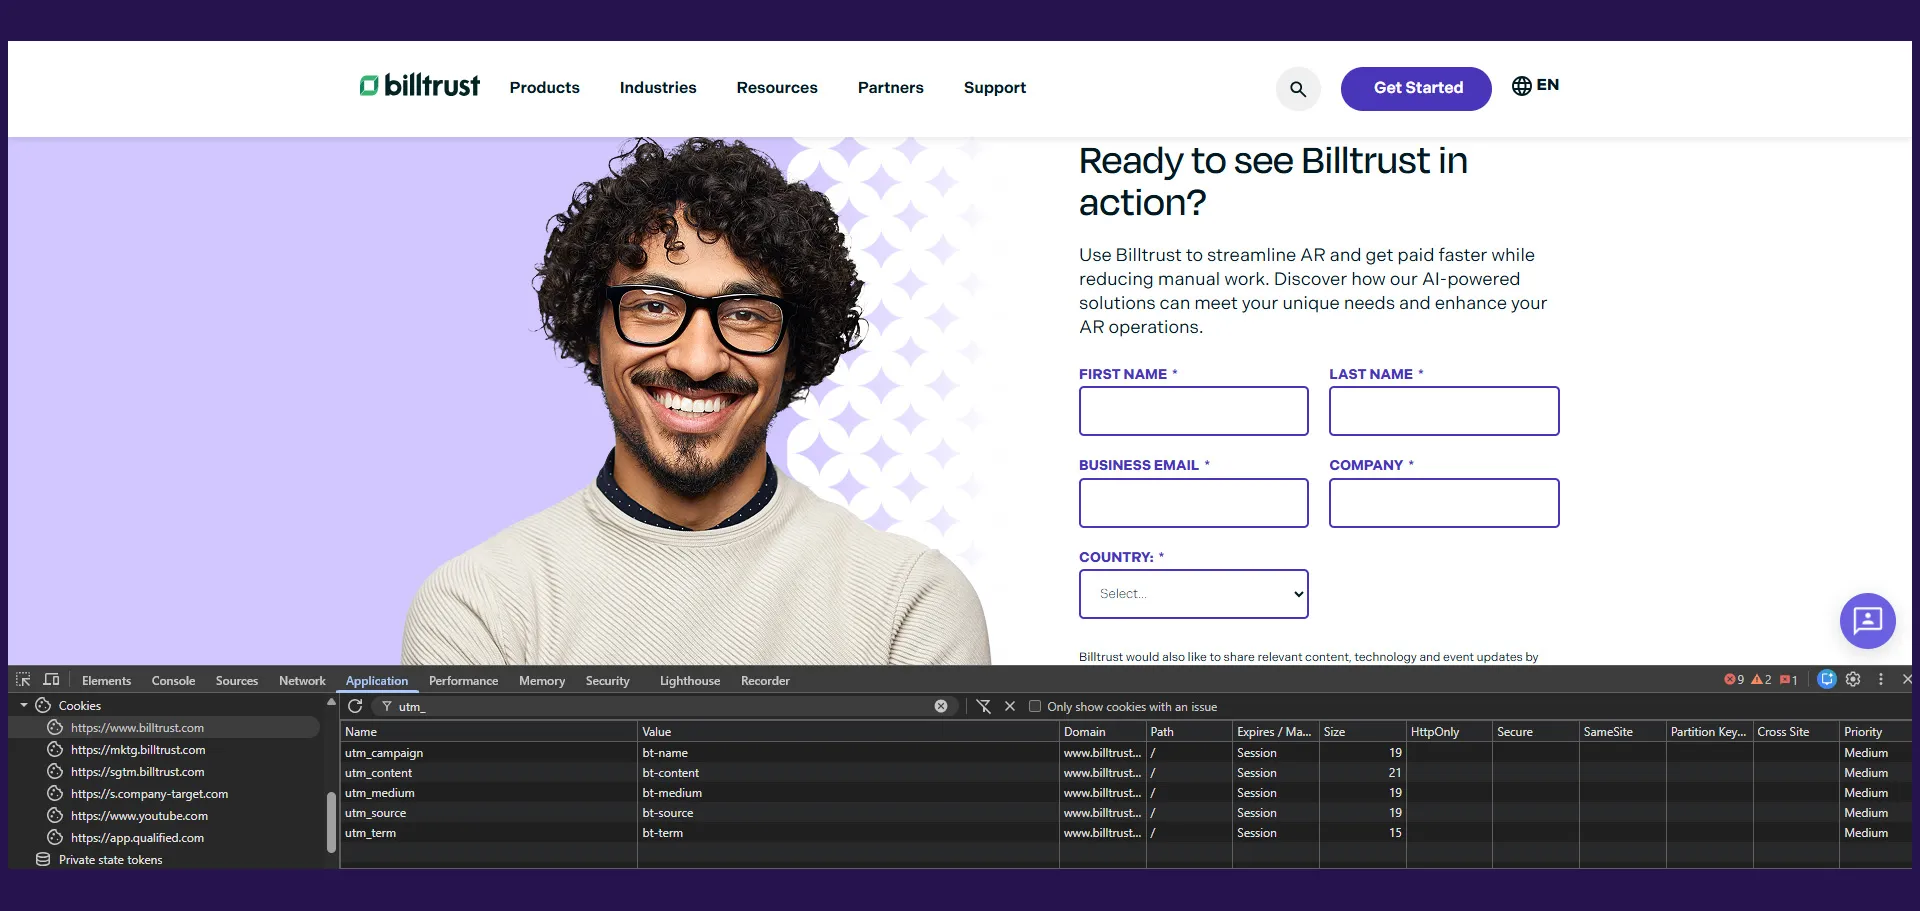
One major technical challenge was making Marketo form data readable inside GA4.
By default, Marketo forms primarily expose numeric form IDs, which are not useful for reporting.
To solve this, I built a custom Marketo form-loading and analytics tracking system directly within WordPress.
This system:
- Loaded Marketo forms dynamically
- Mapped form IDs to readable names
- Standardized generate_lead events
- Passed normalized form metadata into GA4
For example:
Mkto Form ID 1045became:
Contact SalesThis dramatically improved reporting usability.
Without this layer, dashboard readability would have been significantly reduced.
I covered the technical implementation of this system in another post: Building a Smarter Marketo + GA4 Form Tracking System in WordPress.
Keeping GA4 Key Events Clean
One important governance decision was limiting what counted as a Key Event inside GA4.
Only true lead-generation form fills triggered:
generate_leadKey Events.
This included:
- Contact Sales forms
- Gated Content forms
- Event Registration forms
No secondary engagement events were promoted to Key Events.
This ensured:
- Cleaner attribution reporting
- More accurate executive dashboards
- Easier KPI tracking
- Reduced reporting confusion
This governance decision became extremely important as reporting complexity grew.
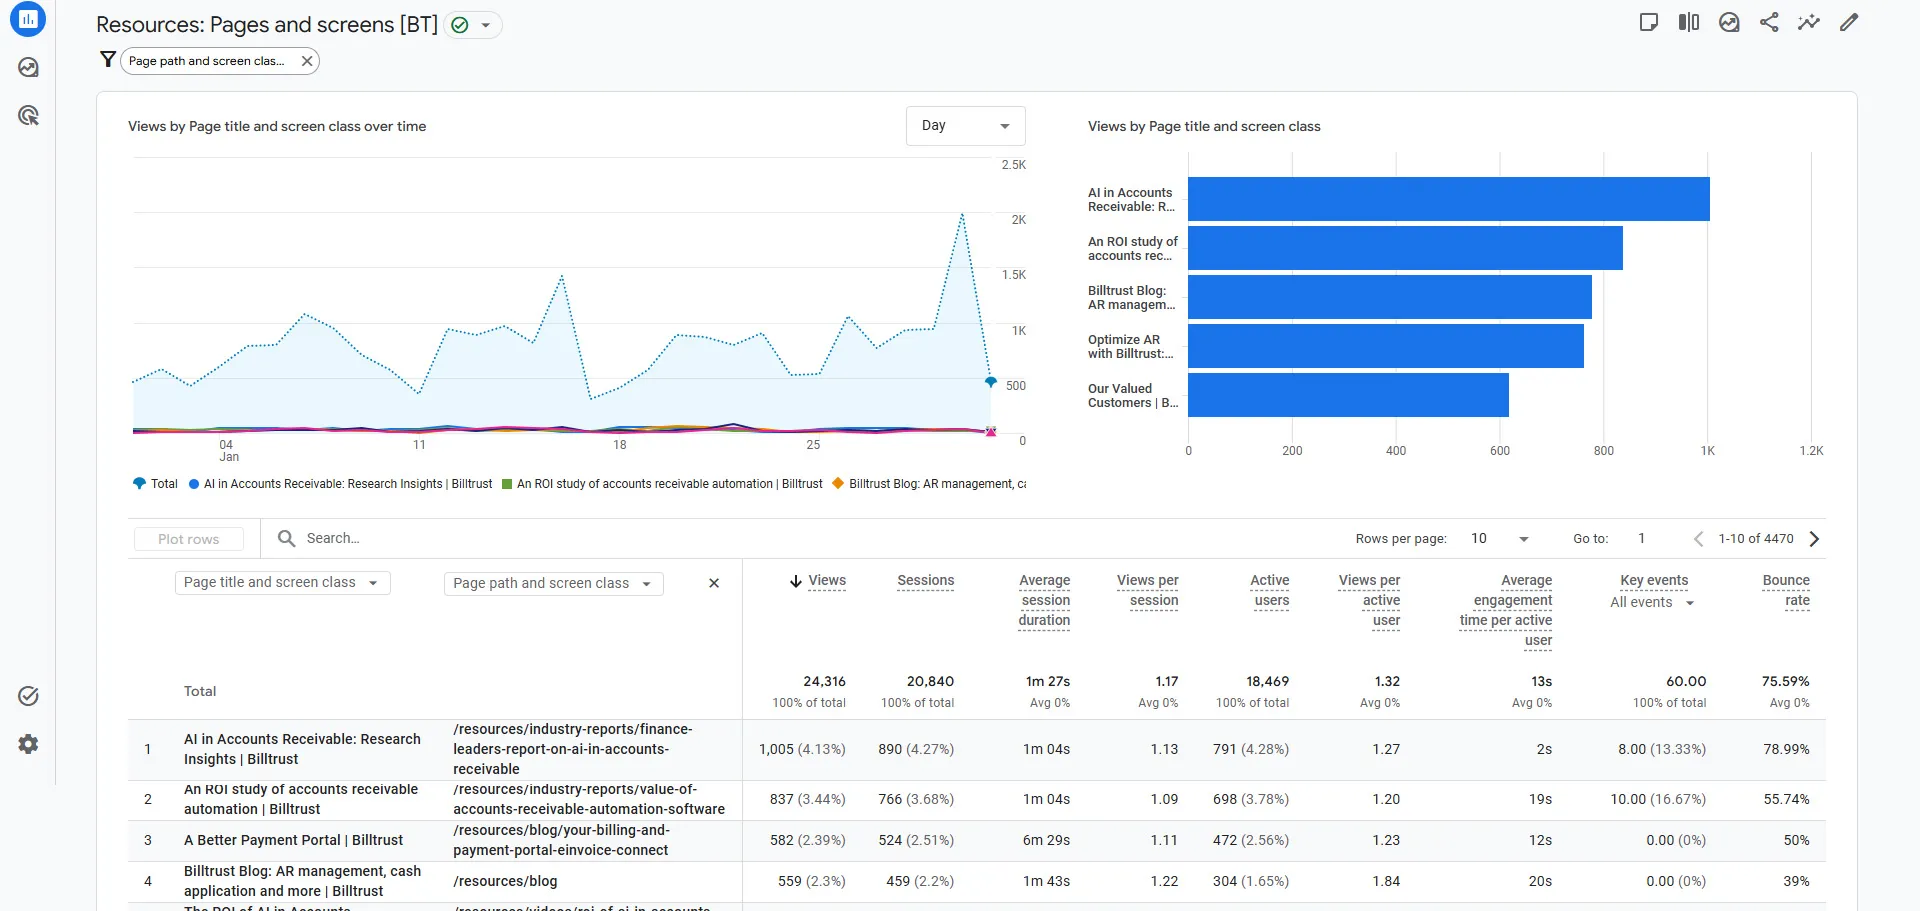
Product, Industry, and Resource Reporting
Beyond lead generation reporting, I also developed a dedicated dashboard topic focused on content and website section performance.
This included reports for:
Product Pages
Industry Pages
Resource Pages
Blog Pages
Case Study Pages
eBook Pages
Industry Report Pages
Solution Guide Pages
Webinar Pages
White Paper Pages
Each report included tables showing:
- Page views
- Sessions
- Active users
- Average session duration
- Views per active user
- Average engagement time
- Key events (form fills)
- Bounce rate
This gave the marketing team an extremely granular understanding of how different content types contributed to engagement and lead generation.
Why This Was Important
This reporting structure fundamentally changed how the marketing organization interacted with analytics.
Instead of asking:
"Where do I find this data?"the conversation shifted to:
"What insights can we act on?"That is a major difference.
The dashboards made it easy to identify:
- High-converting content
- Strong acquisition channels
- Geographic opportunities
- Underperforming campaigns
- Product interest trends
- Content engagement patterns
This allowed teams to move faster and make more informed decisions.
Executive Accessibility
One of the most important outcomes was making analytics accessible to leadership.
Executives and marketing leadership could:
- Navigate dashboards independently
- Access real-time performance data
- Review conversion trends quickly
- Analyze campaign effectiveness
- Understand website contribution to pipeline
This reduced dependency on manual reporting requests and improved organizational visibility into marketing performance.
Technical Takeaways
Building this system reinforced several important analytics principles.
1. Data Structure Matters More Than Dashboards
A dashboard is only as useful as the underlying data model.
The readable Marketo form naming system was critical to making reports usable.
2. Governance Is Essential
Restricting Key Events to true lead-generation actions kept reporting clean and trustworthy.
3. Standardization Improves Adoption
Using consistent report structures across all dashboard topics made reports easier to learn and navigate.
4. Analytics Should Reduce Friction
The best reporting systems reduce the effort required to find answers.
This project significantly improved reporting efficiency across the organization.
Marketing Impact
The overall impact extended well beyond analytics.
The dashboard system improved:
- Marketing visibility
- Campaign optimization
- Content strategy analysis
- Executive reporting
- Attribution clarity
- Cross-team alignment
Most importantly, it transformed analytics from a fragmented reporting tool into an operational decision-making system.
Final Thoughts
One of the biggest misconceptions about analytics is that more data automatically creates better insights.
In reality, the structure, accessibility, and usability of reporting often matter more than the volume of data itself.
By building custom GA4 dashboard collections at Billtrust, I helped create a scalable reporting framework that aligned analytics directly with marketing operations and business goals.
The result was a significantly more efficient, actionable, and executive-friendly analytics experience that empowered teams across the organization to make faster and smarter decisions.