During a recent optimization initiative for Billtrust, I needed a reliable way to measure the impact of performance improvements across deployments. Local Lighthouse audits are invaluable during development, but they’re not a stable source of truth for production - results shift depending on CPU load, browser extensions, network conditions, and hardware, making cross-deployment comparisons unreliable.
To solve this, I built a lightweight dashboard powered by the PageSpeed Insights API. It runs live Lighthouse audits for both mobile and desktop, presents results in a structured comparison view, and writes each execution to a Google Sheet - building a historical dataset that makes performance trends visible over time.
The Problem
Modern websites evolve constantly. Every deployment has the potential to improve, or quietly degrade, performance. The challenge isn’t running Lighthouse audits. It’s doing so consistently enough to compare results across releases.
Chrome DevTools is excellent for debugging, but local audits are influenced by too many environmental variables to be a reliable long-term baseline. The PageSpeed Insights API solves this by running Lighthouse from Google’s infrastructure under standardized conditions, making deployment-to-deployment comparisons meaningful.
For this project, I needed a tool that could:
- Execute audits from a consistent environment
- Compare mobile and desktop performance side-by-side
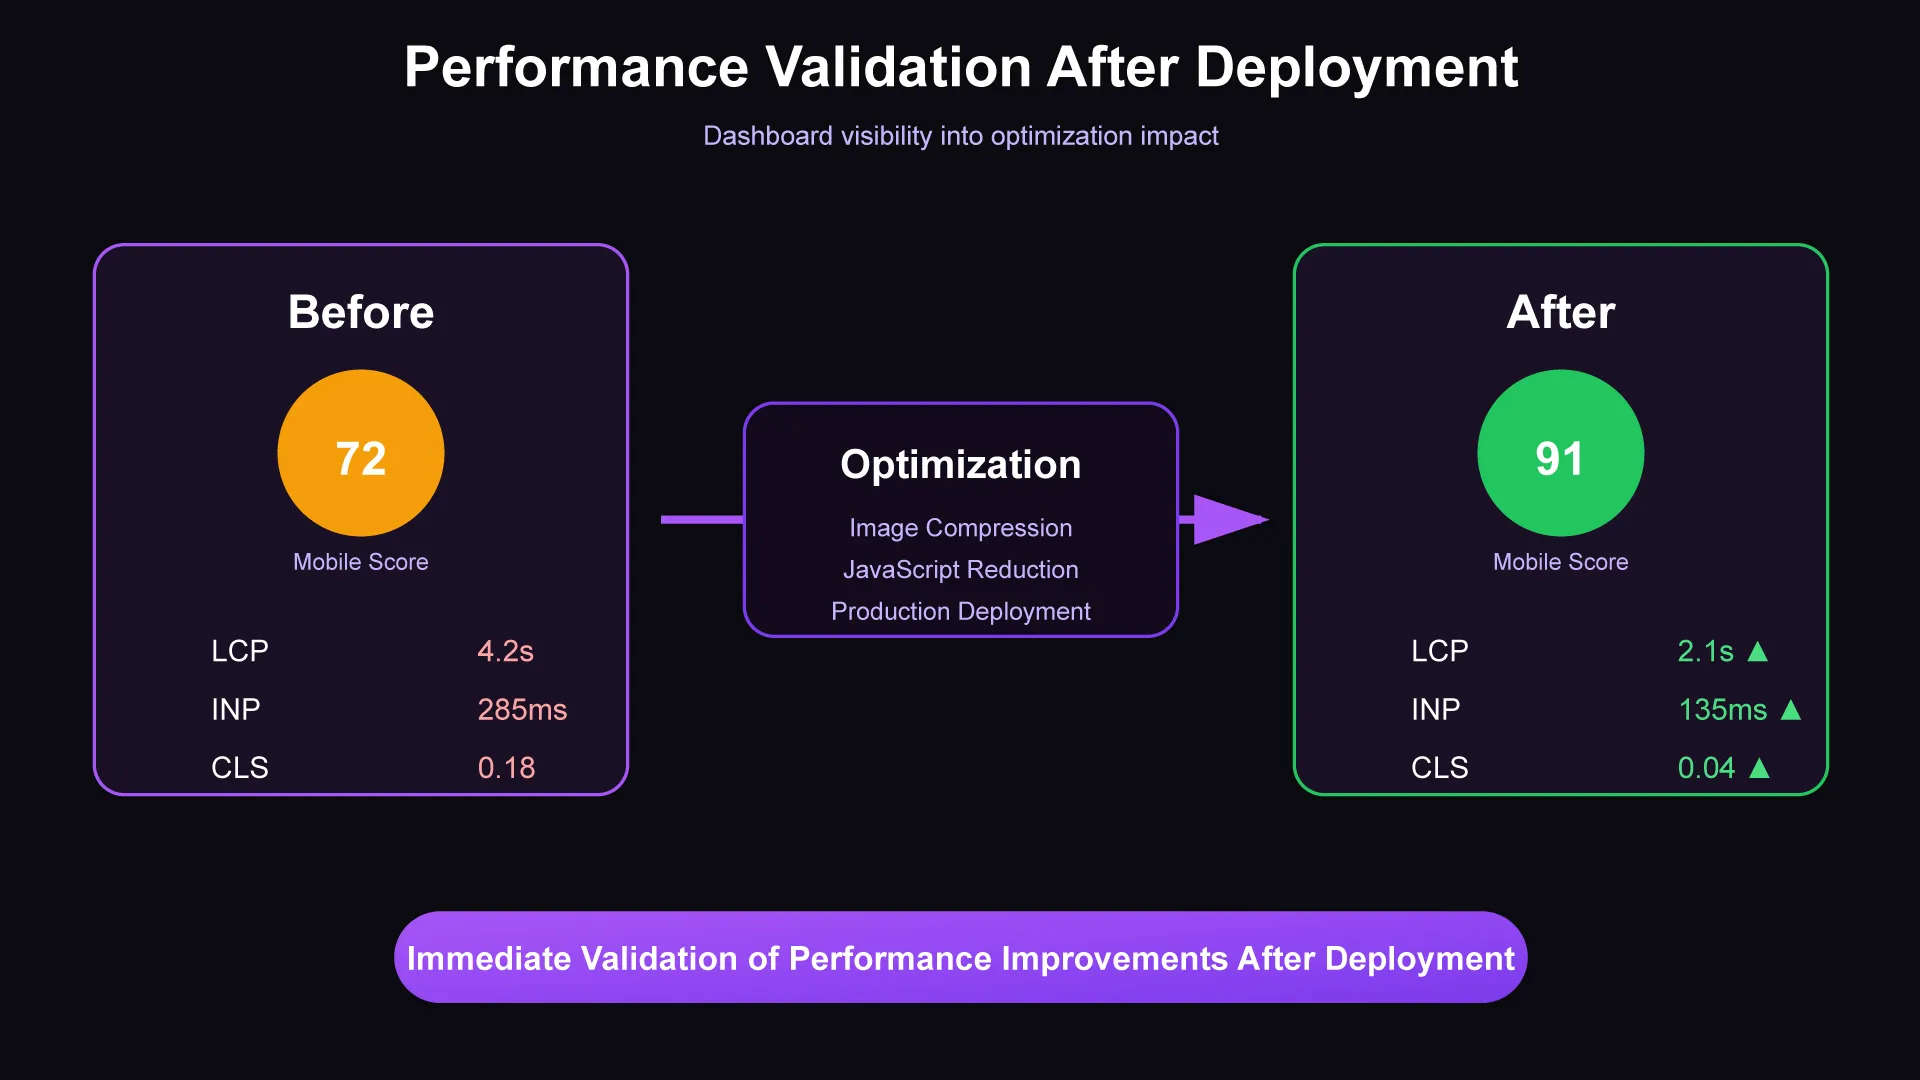
- Validate optimization efforts immediately after deployments
- Build an auditable historical record over time
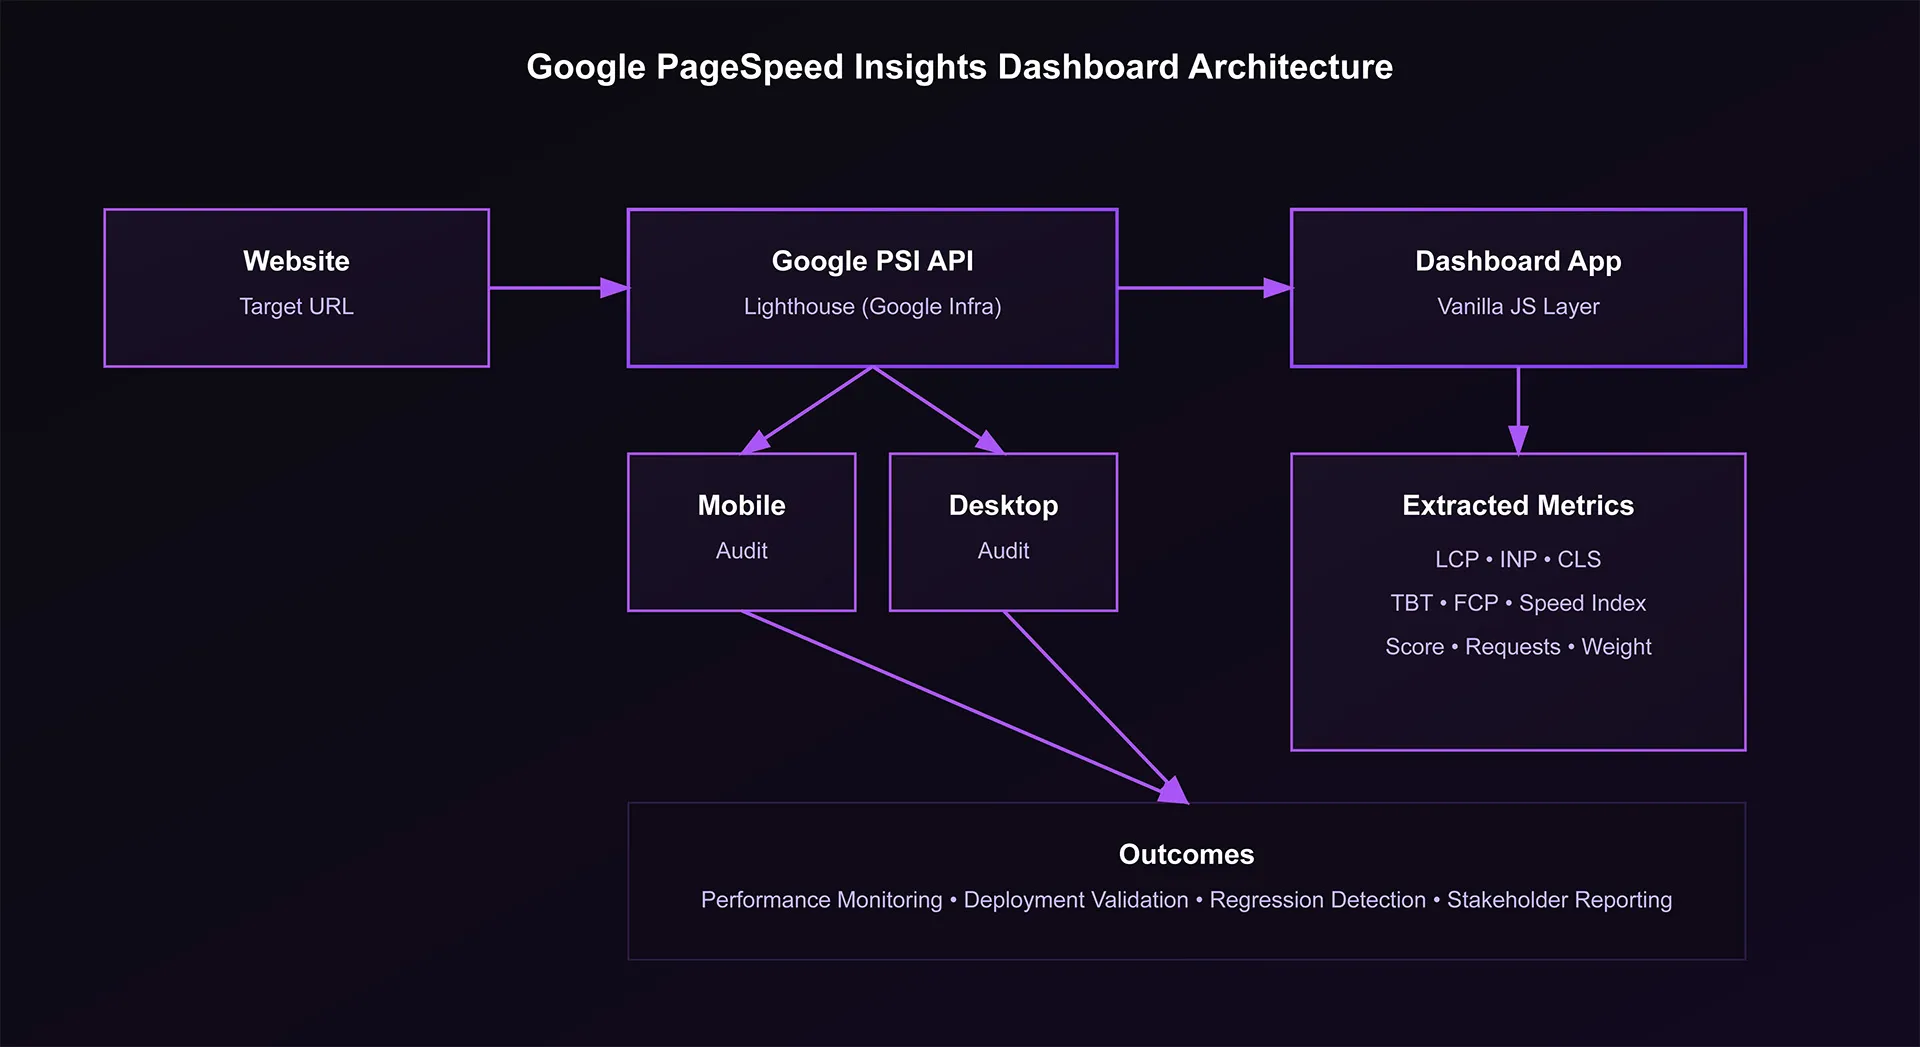
What the Dashboard Does
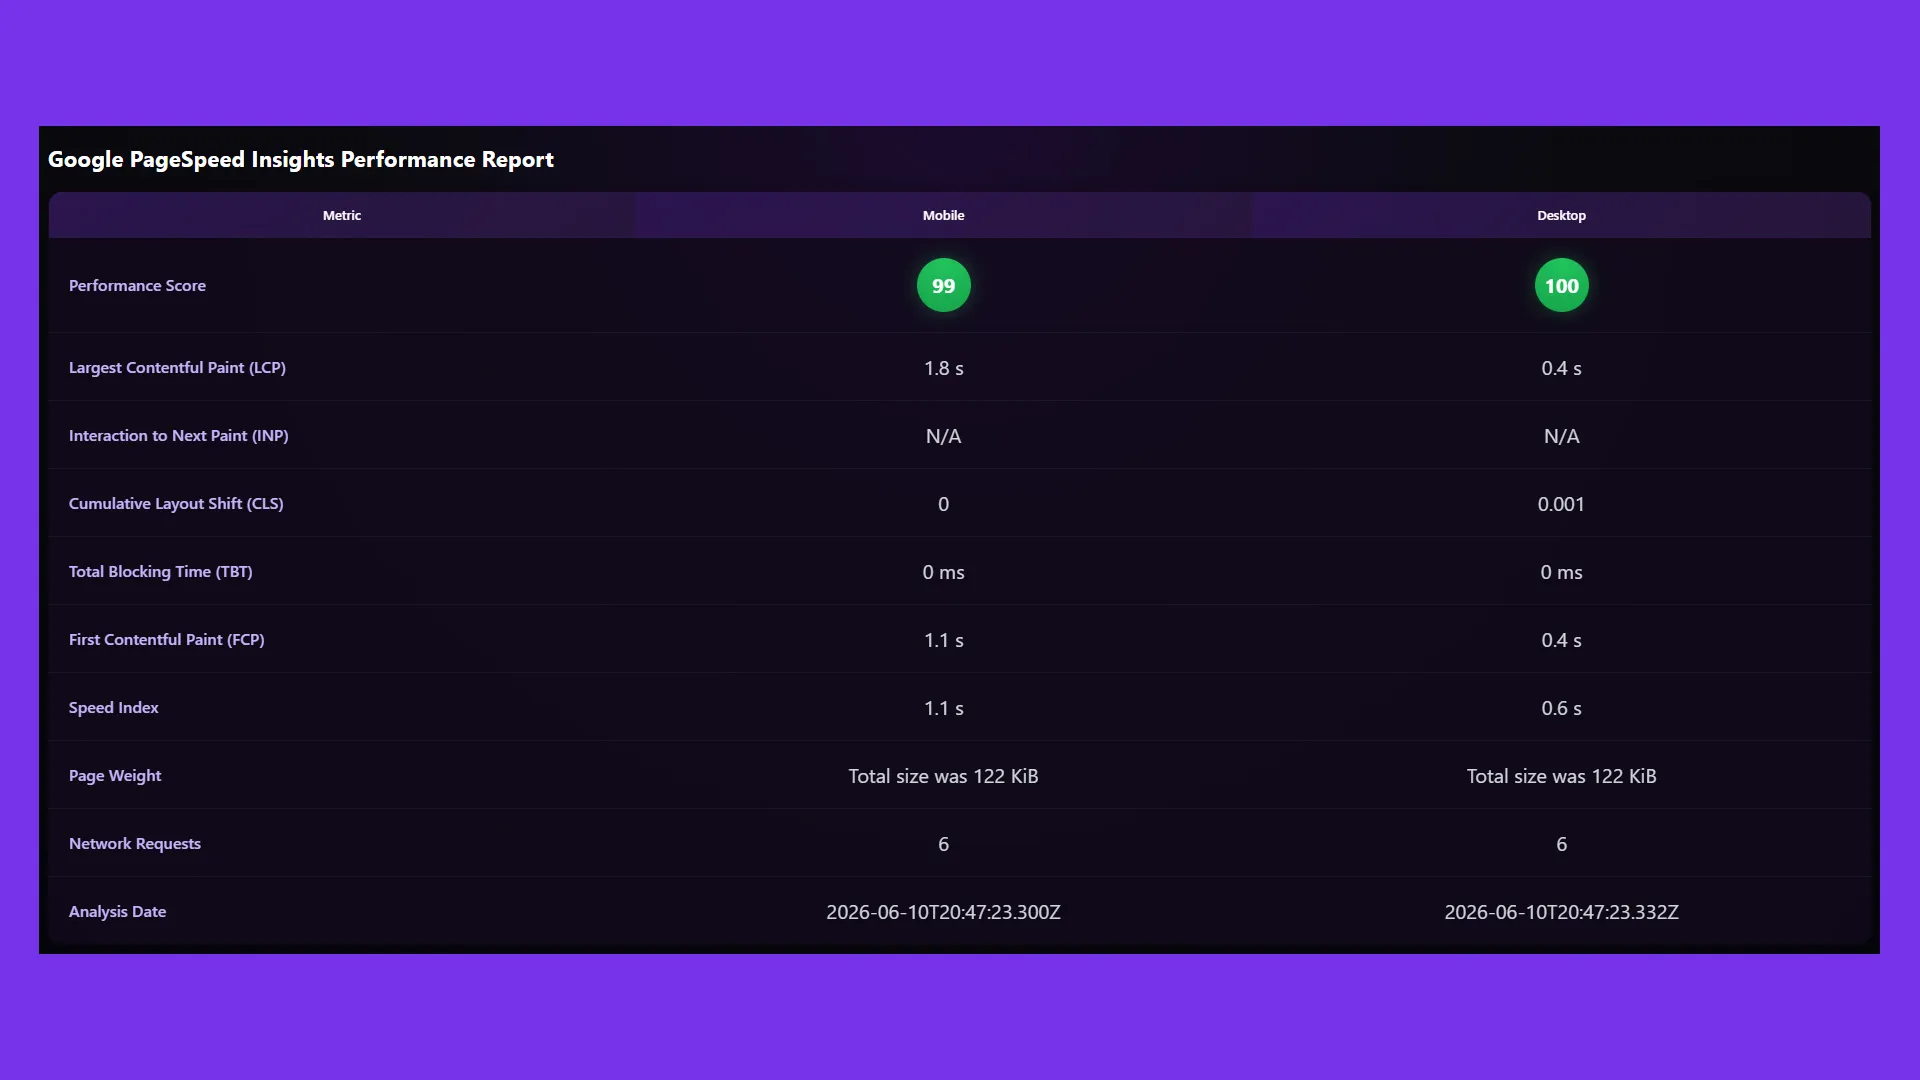
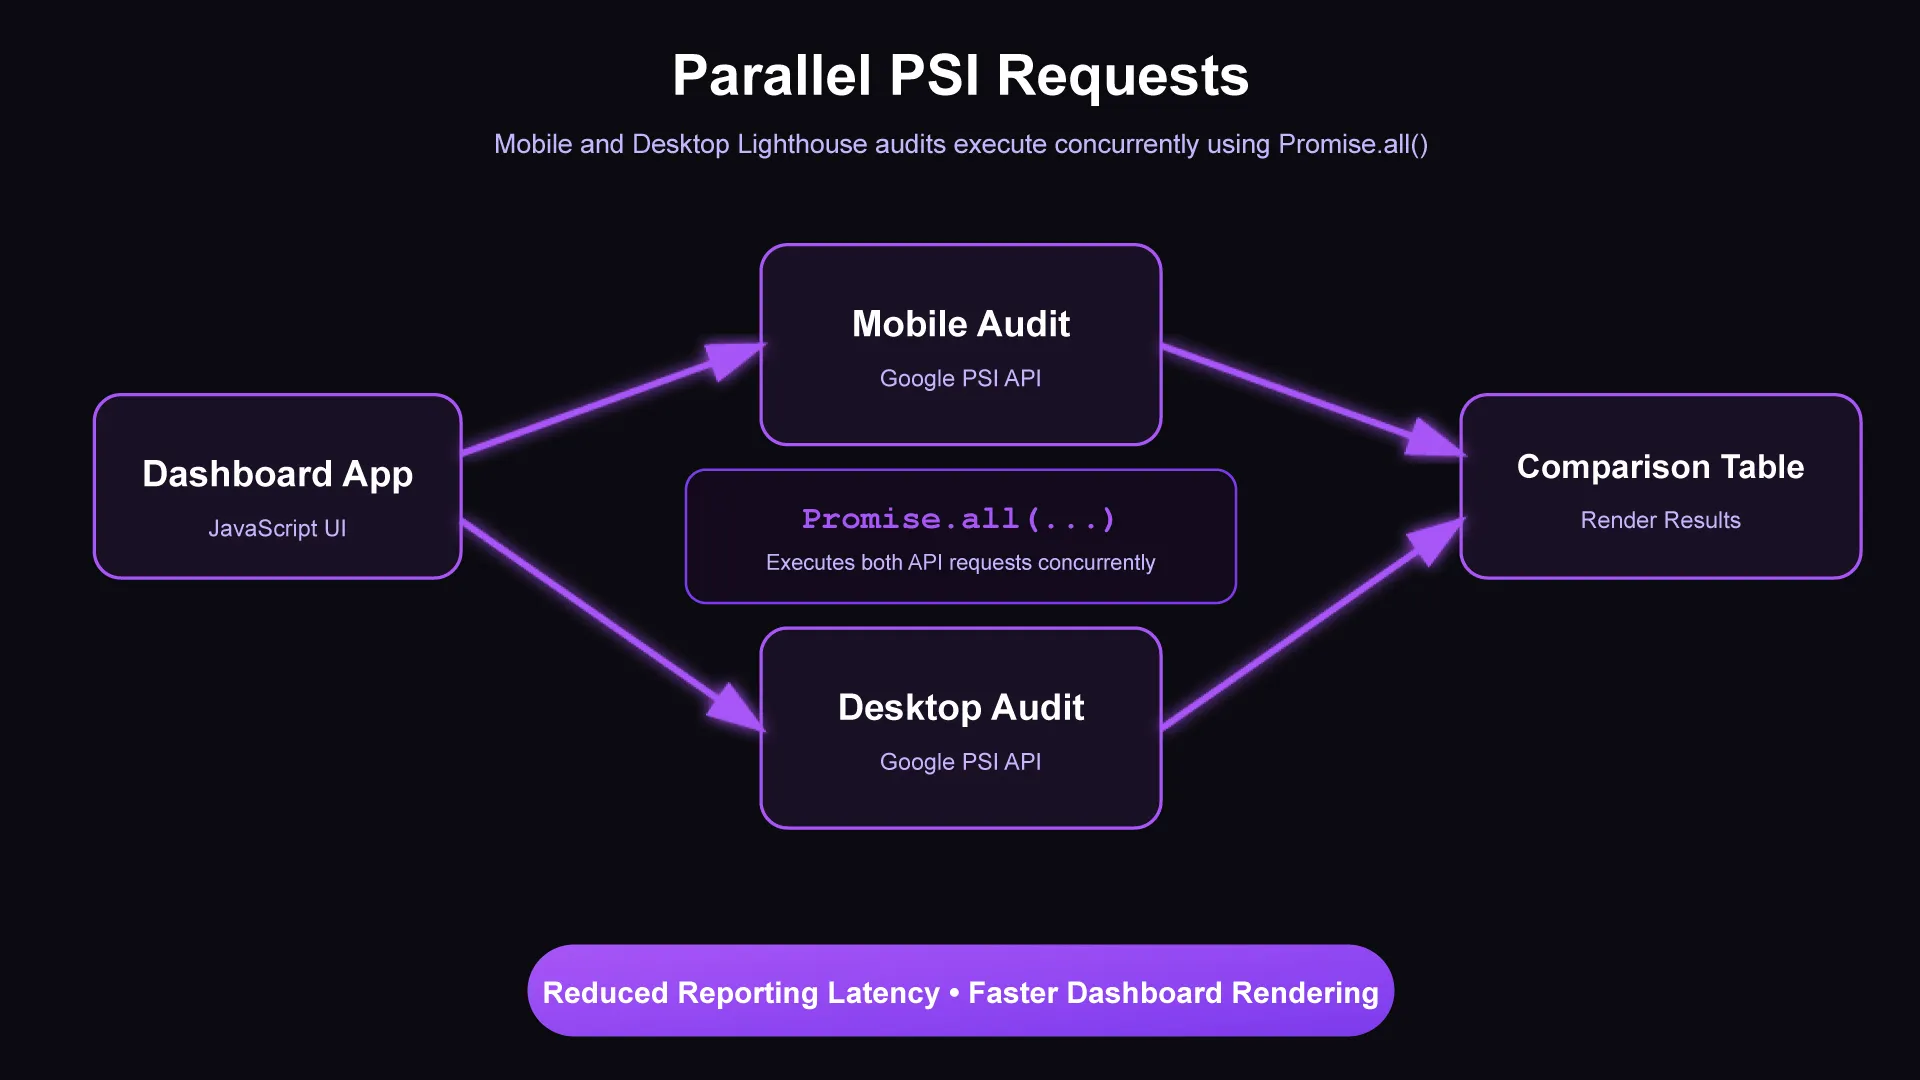
The application is a client-side dashboard built with HTML, CSS, and vanilla JavaScript. On load, it fires two parallel API requests (one mobile audit, one desktop) using Promise.all() to minimize wait time and ensure both reports represent the same time window.
const [mobileData, desktopData] = await Promise.all([getPSIData('mobile'), getPSIData('desktop')]);Results are extracted from the raw Lighthouse response through a dedicated transformation layer and presented side-by-side. Performance scores are color-coded for immediate readability (green 90–100, orange 50–89, red 0–49), and each execution writes its results to a Google Sheet for historical tracking.
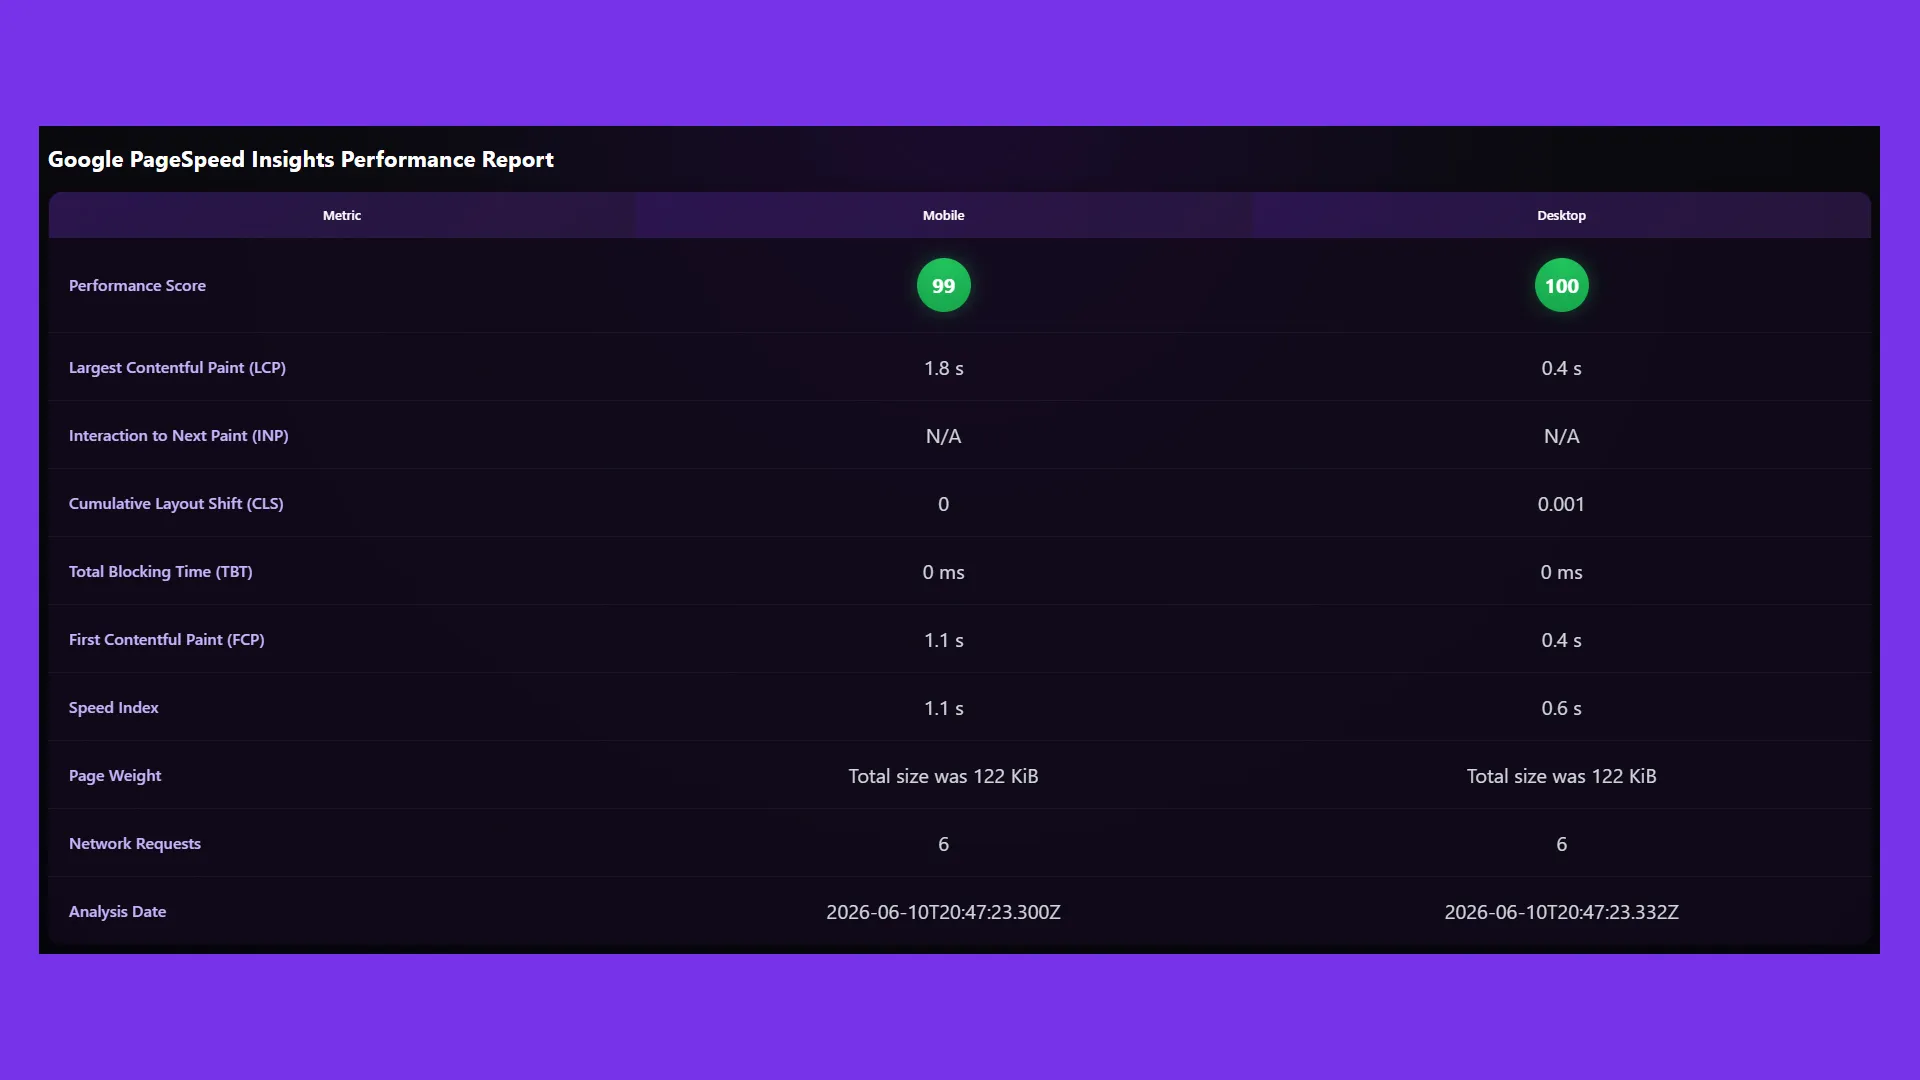
Metrics Tracked
The dashboard surfaces the metrics most relevant to ongoing optimization work:
| Metric | Description |
|---|---|
| Performance Score | Overall Lighthouse performance score |
| Largest Contentful Paint (LCP) | Loading performance |
| Interaction to Next Paint (INP) | Responsiveness metric |
| Cumulative Layout Shift (CLS) | Visual stability |
| Total Blocking Time (TBT) | Main thread blocking |
| First Contentful Paint (FCP) | Initial render timing |
| Speed Index | Visual load progression |
| Page Weight | Total transferred resources |
| Network Requests | Number of requests made |
| Analysis Timestamp | Time of audit execution |
Historical Performance Reporting
A single audit is just a snapshot. The real value emerges when results accumulate over time.
After each execution, the extracted metrics are written to a structured Google Sheet. Over weeks and months, that dataset makes it possible to detect regressions after releases, measure the impact of optimization sprints, and communicate performance trends to both technical and non-technical stakeholders.
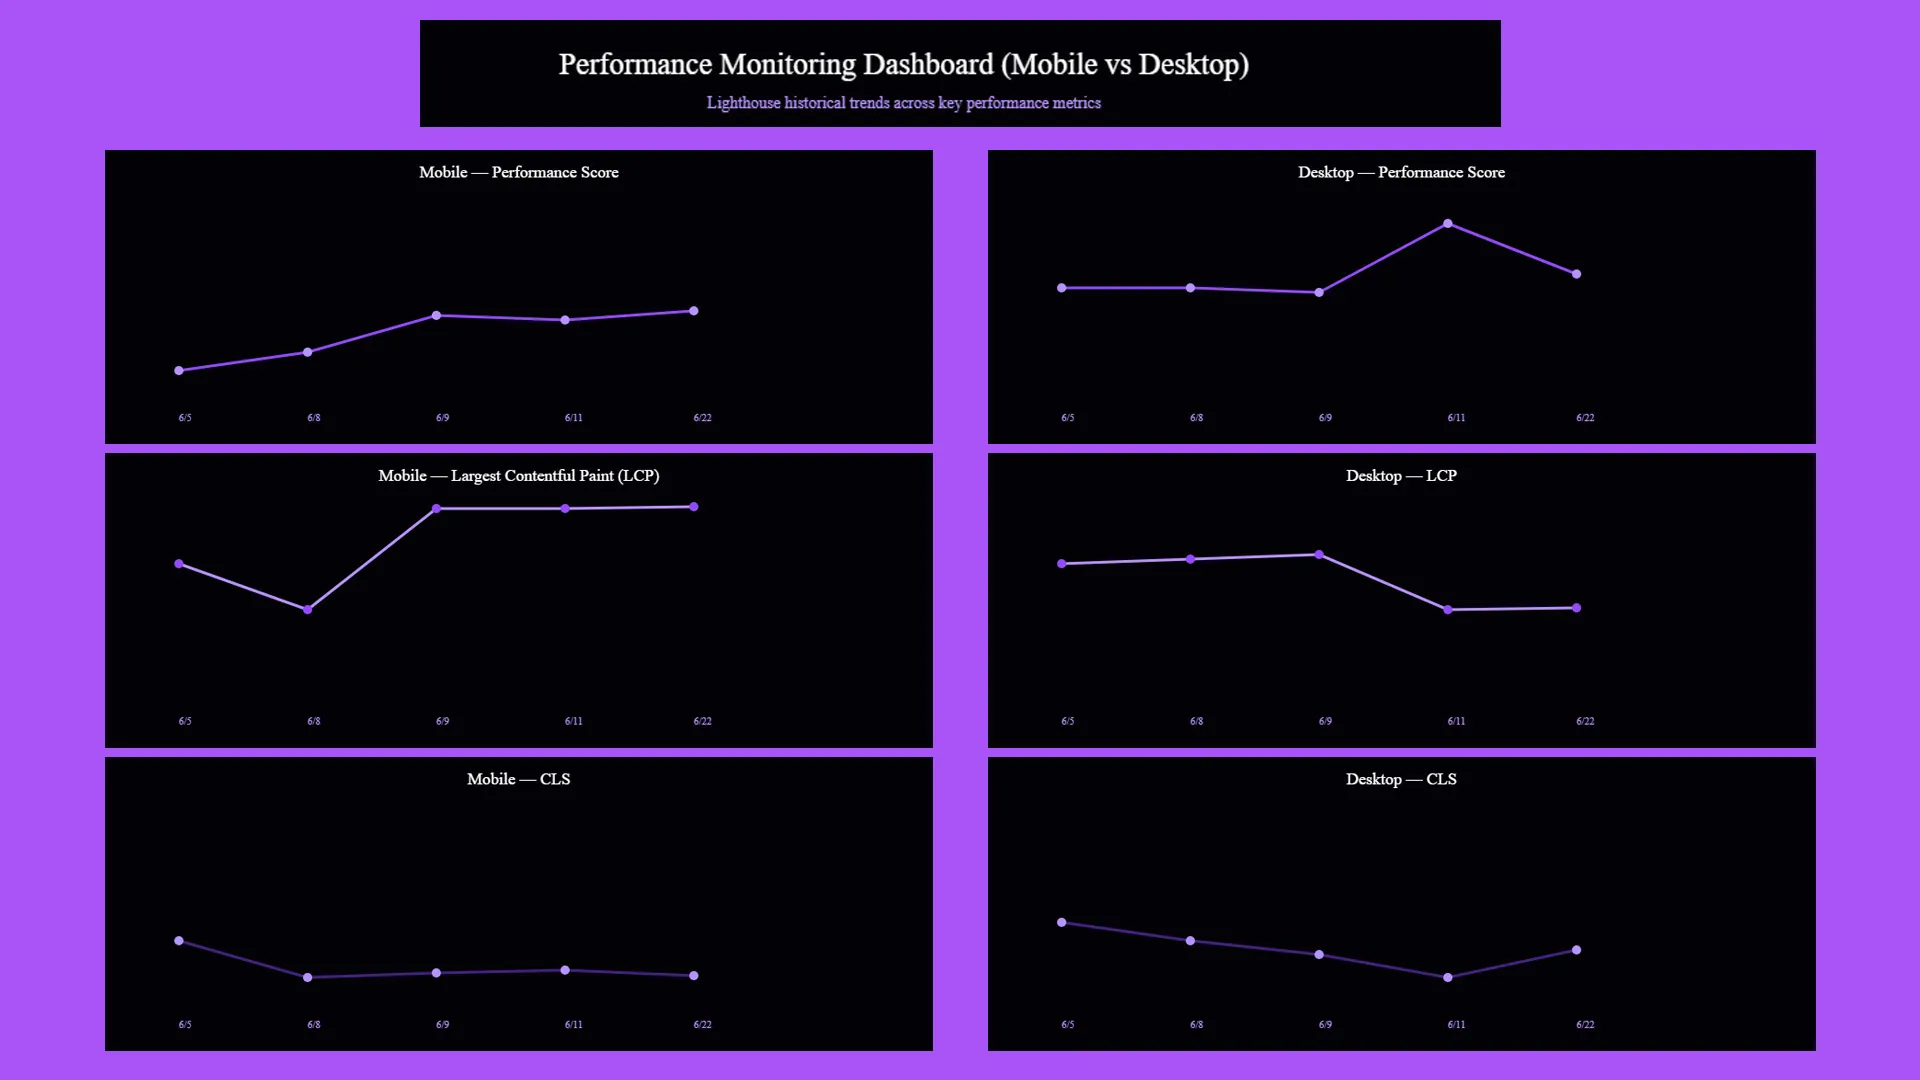
This historical layer is what differentiates the tool from a standard PageSpeed Insights interface, instead of isolated snapshots, you can observe how performance evolves as the product changes.
Architecture
The system is intentionally dependency-free and built from three components:
- A browser-based JavaScript dashboard that triggers audits on demand
- The PageSpeed Insights API, which runs Lighthouse in a consistent cloud environment
- A Google Sheets data store for persistence and trend visualization
User Action (Dashboard Trigger)
        ↓
PageSpeed Insights API (Lighthouse Execution)
        ↓
Metric Extraction Layer
        ↓
Dashboard UI (Immediate Visibility)
        ↓
Google Sheets (Historical Storage)
        ↓
Trend Analysis & Reporting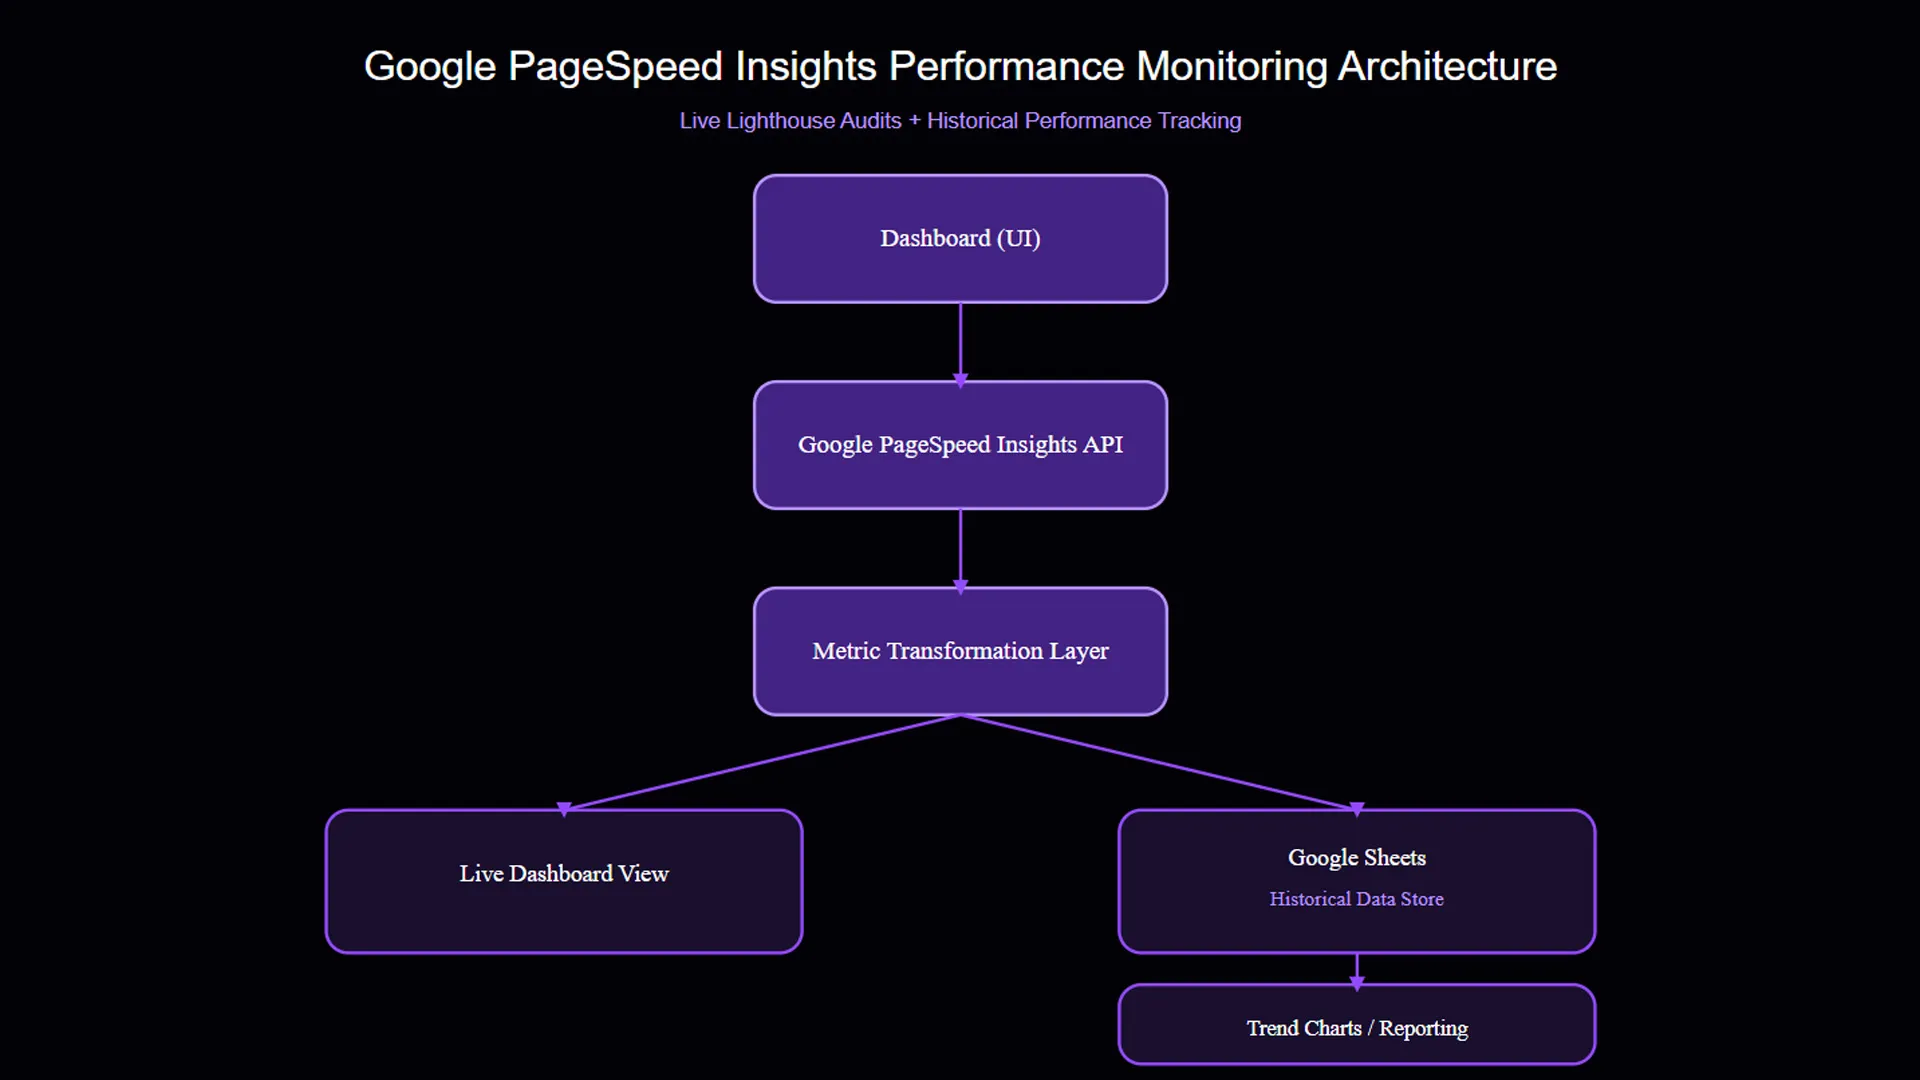
Key Engineering Decisions
Treating Lighthouse Data as a Transformation Problem
The raw Lighthouse API response is deeply nested and not suitable for direct UI rendering. Rather than coupling the interface to the API structure, I introduced a dedicated extraction layer:
function extractMetrics(data) {
  const audits = data.lighthouseResult.audits;

  return {
    score: Math.round(data.lighthouseResult.categories.performance.score * 100),
    lcp: audits['largest-contentful-paint']?.displayValue || 'N/A',
    inp: audits['interaction-to-next-paint']?.displayValue || 'N/A',
    cls: audits['cumulative-layout-shift']?.displayValue || 'N/A',
    tbt: audits['total-blocking-time']?.displayValue || 'N/A',
    fcp: audits['first-contentful-paint']?.displayValue || 'N/A',
    speedIndex: audits['speed-index']?.displayValue || 'N/A',
    pageWeight: audits['total-byte-weight']?.displayValue || 'N/A',
    requests: audits['network-requests']?.details?.items?.length || 'N/A',
    timestamp: data.analysisUTCTimestamp,
  };
}
This decouples UI logic from API structure, simplifies future metric changes, and provides a buffer against upstream API updates.
Google Sheets as the Data Store
Rather than introducing a backend service or database, audit results are persisted directly to a Google Sheet. This keeps the architecture lightweight while offering real benefits: no infrastructure to manage, built-in charting, and easy access for non-technical stakeholders without additional tooling.
The tradeoff is that the dashboard is triggered manually but for a post-deployment validation workflow, that’s an acceptable constraint.
API Key Exposure
Running the dashboard client-side means the PageSpeed Insights API key is exposed in the browser. In this context, that risk is mitigated by restricting the key to the PSI API only, limiting it to internal usage, and keeping request volume controlled. For a public-facing deployment, a lightweight proxy or server-side execution would be the right path.
Business Impact
This project solves a real operational gap: most teams rely on ad hoc Lighthouse audits with no way to compare results meaningfully over time. By combining consistent API-based measurement with persistent historical storage, the system enables:
- Faster validation cycles: immediately confirm whether a deployment helped or hurt performance
- Consistent measurement baseline: results come from Google’s infrastructure, not a developer’s laptop
- Stakeholder-friendly reporting: simplified metrics and trend charts communicate progress without requiring Lighthouse expertise
- Regression detection: gradual degradation becomes visible before it becomes a problem
Lessons Learned
A few principles this project reinforced:
Use the right tool for each phase. Chrome DevTools Lighthouse is ideal for debugging during development. The PageSpeed Insights API is better suited for long-term tracking. They’re complementary, not interchangeable.
Simplicity compounds. Decisions like parallelizing API requests, separating data extraction from rendering, and using Sheets instead of a database each seem minor in isolation. Together, they create a system that’s significantly more usable and maintainable than a direct API wrapper would be.
Historical context is where the value lives. A single performance score answers “how is the site performing right now.” A dataset of scores over time answers “is performance getting better or worse, and when did it change?”
Conclusion
Performance optimization is an ongoing discipline, not a one-time task. This system provides both immediate visibility into current Lighthouse metrics and a growing historical record that makes performance trends interpretable over time.
As a Principal Web Technologist, I’m often focused on building practical systems that bridge engineering execution and business visibility. This is a small but concrete example of that, turning isolated performance measurements into a structured, repeatable workflow that supports better decision-making across teams.