Historical snowfall data has always been a point of fascination for skiers and snowboarders. Guests naturally compare current winter conditions to legendary seasons from the past, discuss major storm cycles, and analyze how snowfall patterns vary month-to-month throughout the season.
While working at Sierra-at-Tahoe, I developed an interactive snowfall history visualization designed to make that data engaging, accessible, and easy to explore across devices.
The experience combined historical snowfall records with animated data visualization using Google Charts, allowing users to compare winter seasons by month and view total snowfall accumulation across entire years. The page quickly became one of the resort’s most highly trafficked informational experiences, generating strong engagement and positive feedback from longtime guests and weather-focused visitors alike.
The project demonstrated how thoughtful frontend engineering and data visualization can transform static operational data into an engaging digital experience that supports both user interest and business engagement goals.
What the Application Does
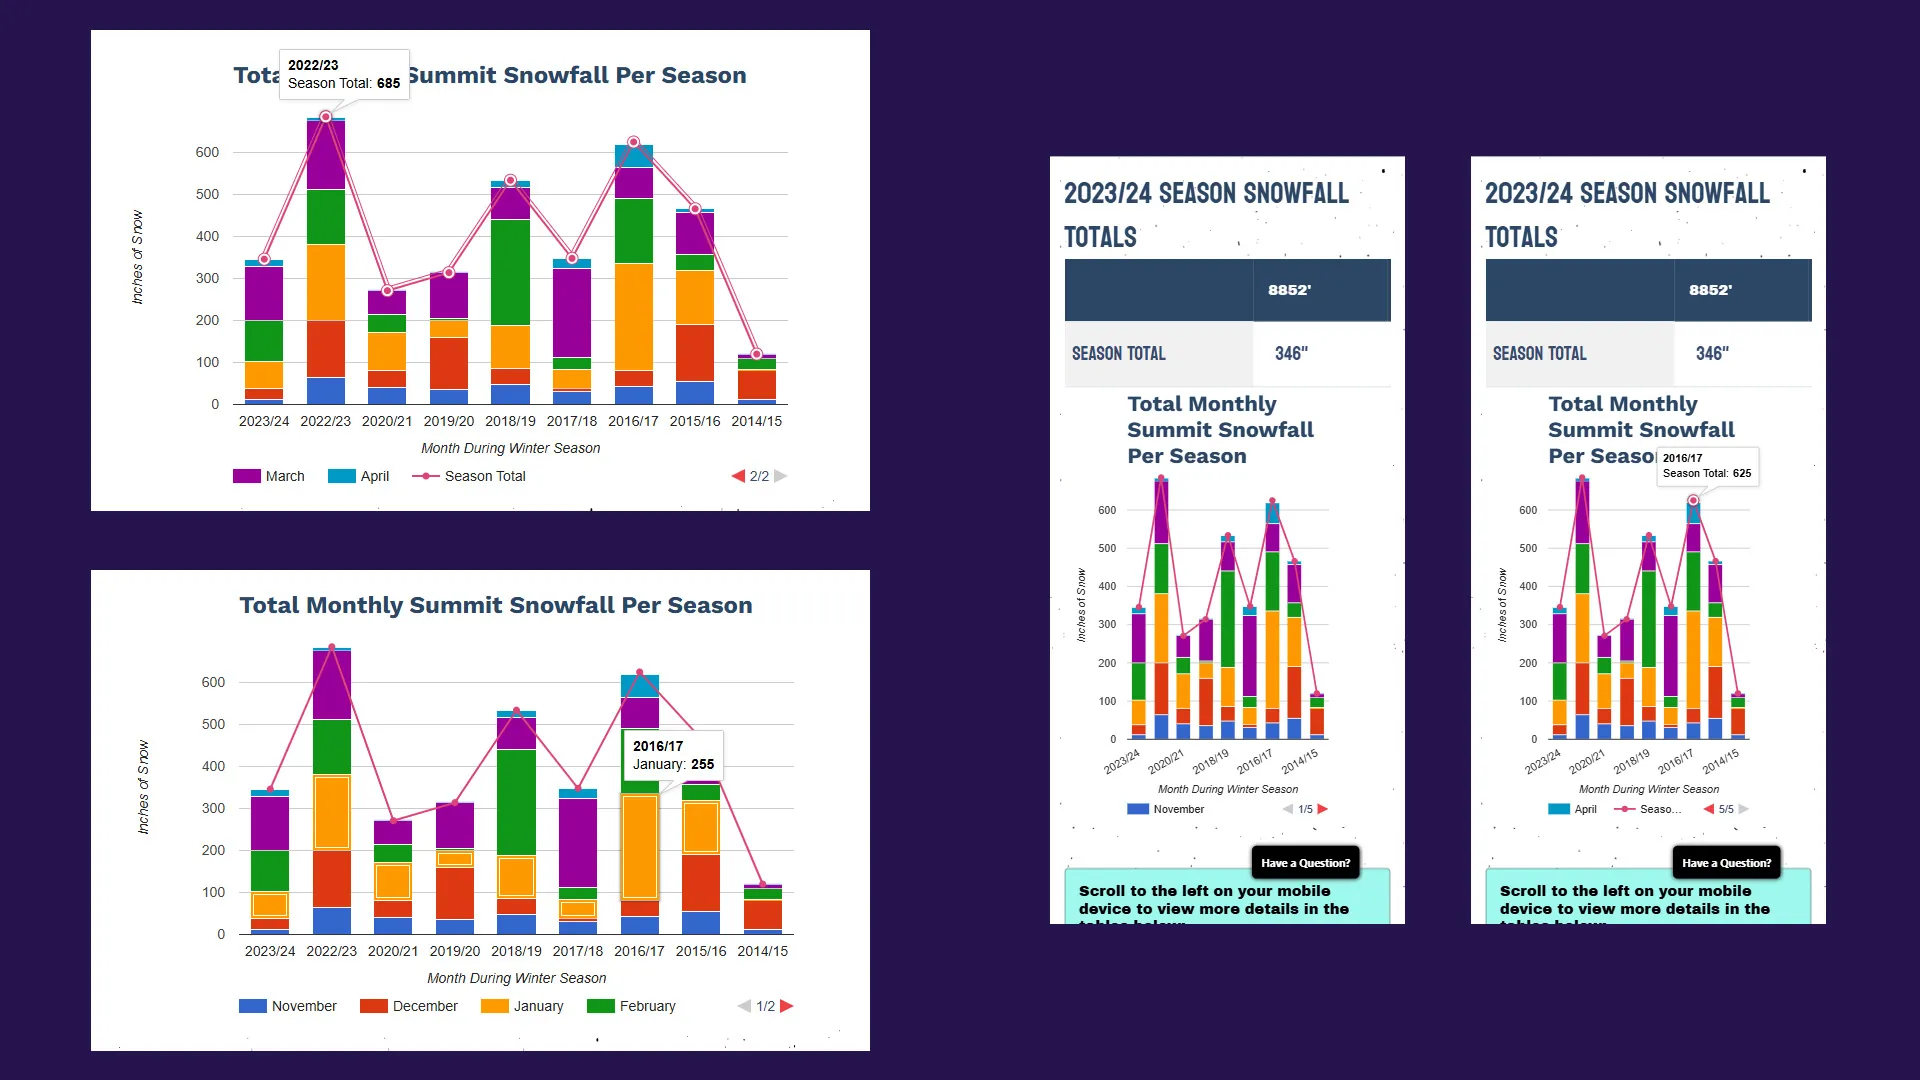
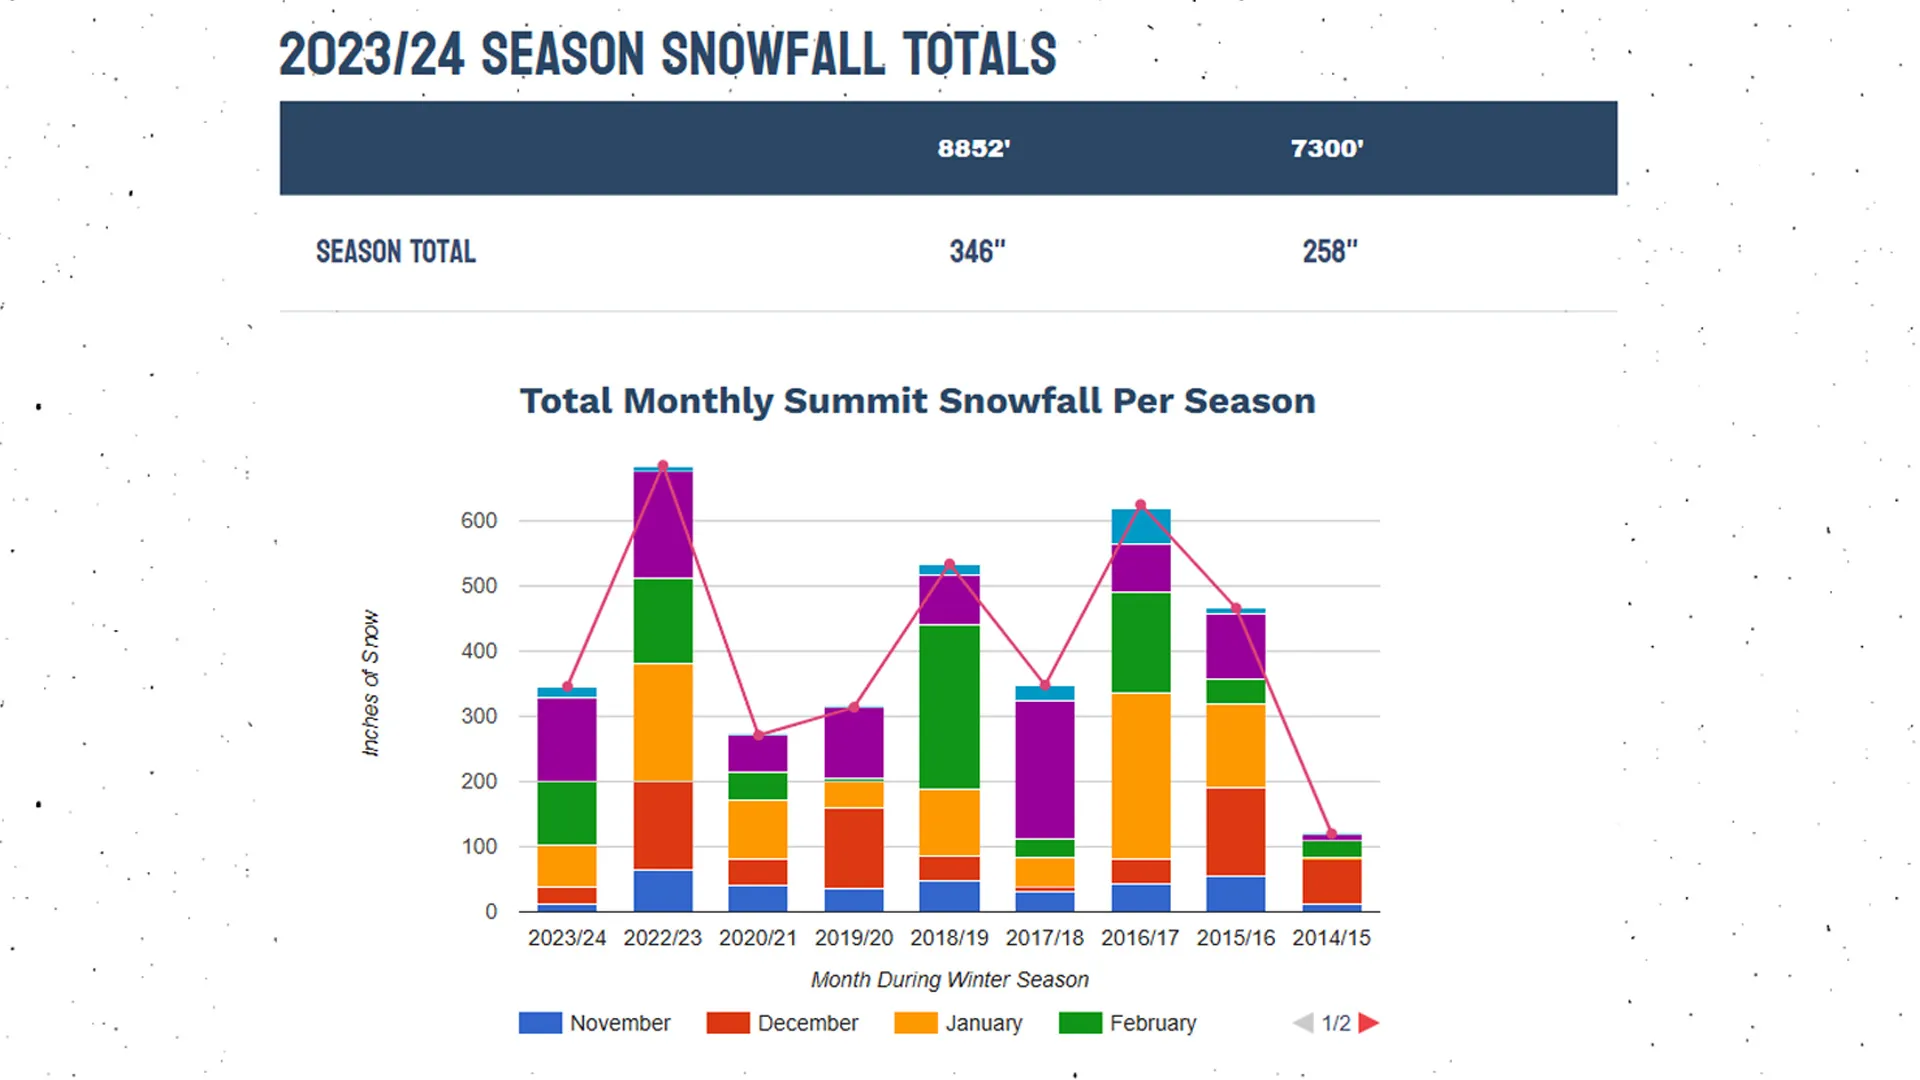
The snowfall visualization displays historical summit snowfall totals by month across multiple winter seasons.
Users can visually compare:
- November snowfall totals across years
- Peak winter storm months
- Seasonal snowfall progression
- Total annual snowfall accumulation
- High-snow versus low-snow seasons
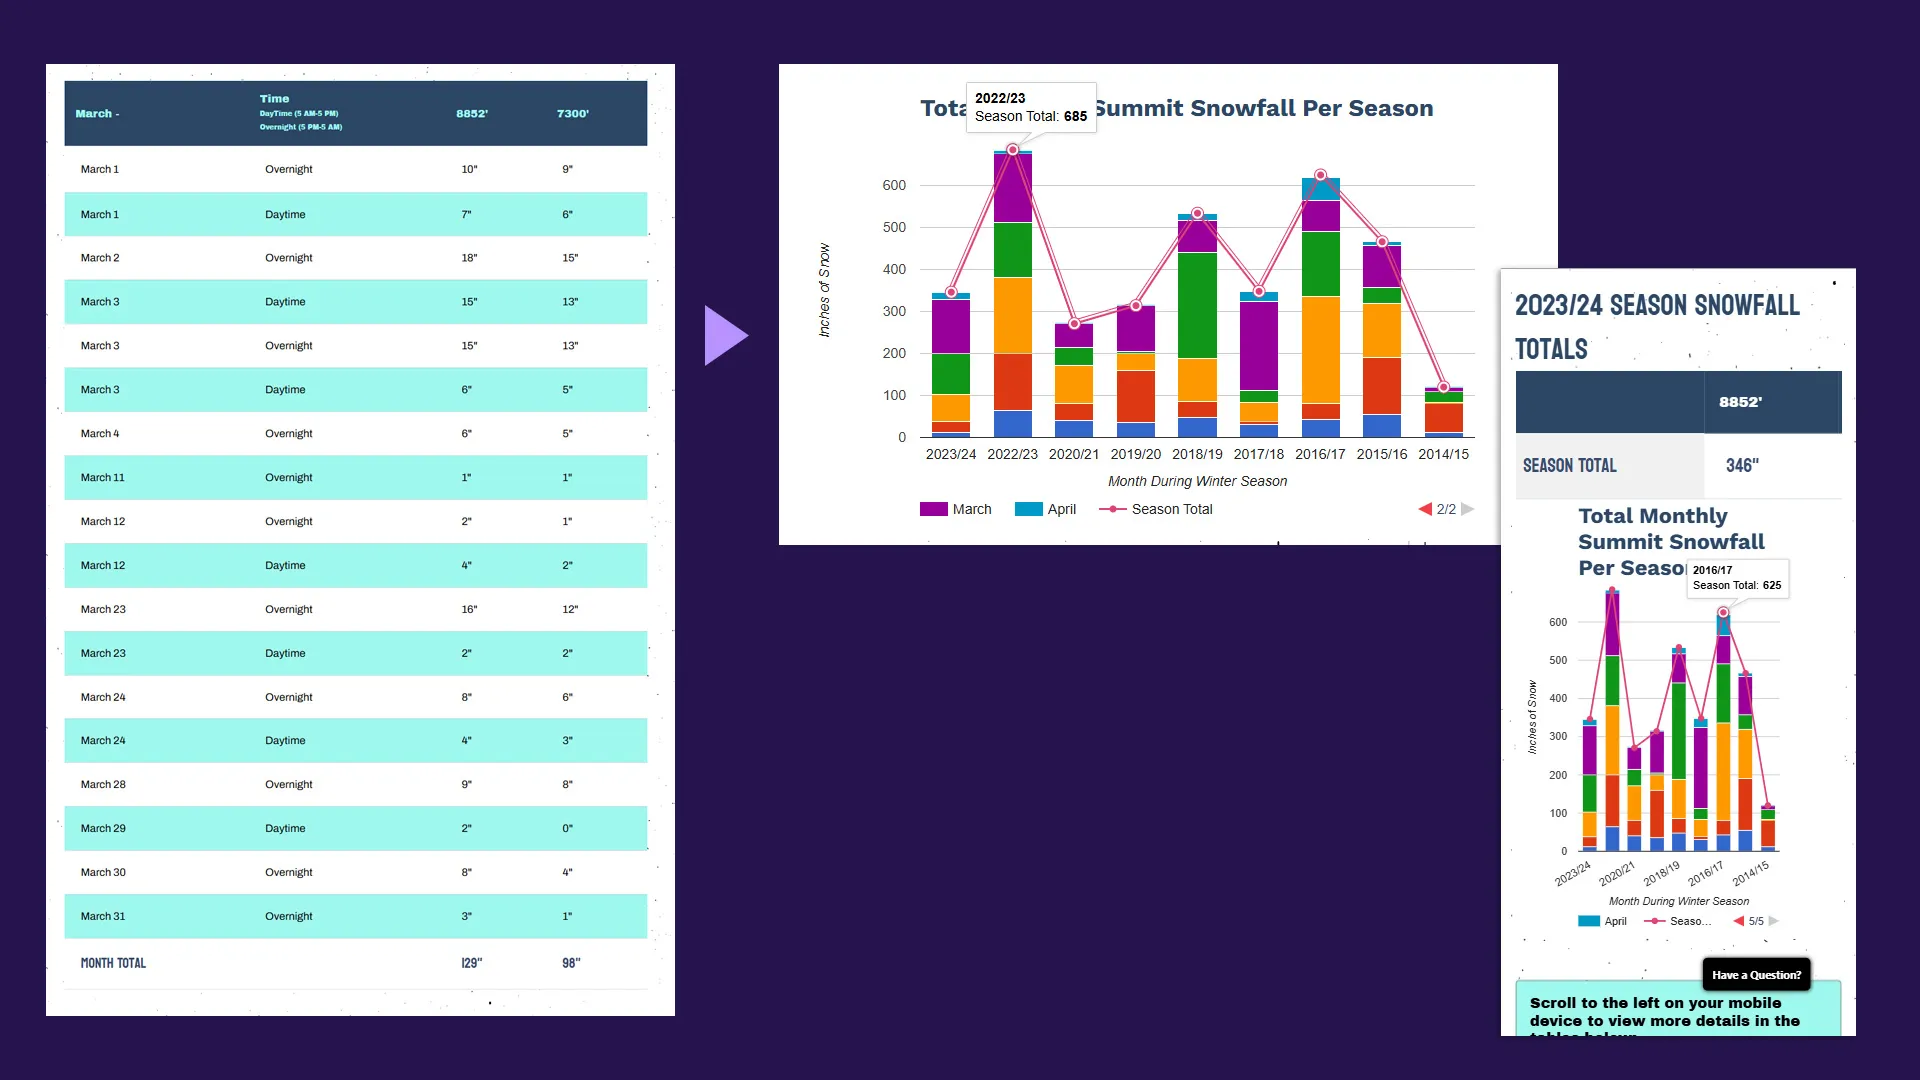
The chart combines stacked monthly snowfall bars with a line overlay representing total seasonal snowfall.
This creates two layers of insight simultaneously:
- Monthly snowfall distribution
- Overall seasonal snowfall totals
The experience was intentionally designed to work equally well on desktop and mobile devices while remaining performant and easy to maintain.
The User Problem It Solved
Skiers and snowboarders are highly weather-focused audiences. Snowfall totals heavily influence:
- Trip planning
- Pass purchasing decisions
- Seasonal expectations
- Resort comparisons
- Community discussion
Before this implementation, historical snowfall information existed primarily as static tables or archived reports that were difficult to scan and compare visually.
Users wanted a faster and more intuitive way to answer questions such as:
- How does this season compare to past years?
- Which winters had the strongest January storms?
- Was snowfall concentrated early or late in the season?
- How unusual was a specific winter?
- Which years delivered the deepest snowpack overall?
The visualization transformed historical data into a highly interactive comparison tool that made patterns immediately understandable.
Instead of requiring users to interpret spreadsheets or dense tables, the chart allowed visitors to absorb snowfall trends visually within seconds.
Frontend Architecture Overview
The application was intentionally lightweight and built entirely with:
- HTML
- Vanilla JavaScript
- Google Charts
- Responsive CSS
The chart itself was rendered using Google’s ComboChart, which allowed multiple visualization types to coexist within a single chart instance.
The page structure was intentionally simple:
<script type="text/javascript" src="https://www.gstatic.com/charts/loader.js"></script>

<div class="row">
  <div class="col-md-12">
    <div id="chart_div" class="chart"></div>
  </div>
</div>
Google Charts handled:
- Rendering
- Animation
- Stacked bars
- Line overlays
- Legends
- Responsive scaling
- Axis calculations
The implementation avoided unnecessary frontend complexity while still delivering a polished interactive experience.
Structuring Historical Snowfall Data
The snowfall data was structured using Google Charts’ arrayToDataTable() format:
var data = google.visualization.arrayToDataTable([
  ['Month', 'November', 'December', 'January', 'February', 'March', 'April', 'Season Total'],
  ['2018/19', 47, 36, 102, 251, 120, 80, 641],
  ['2017/18', 32, 7, 44, 30, 212, 23, 348],
  ['2016/17', 42, 39, 255, 154, 74, 54, 625],
]);
Each season became a single row of comparative snowfall data.
This structure made it straightforward to:
- Add future seasons
- Update snowfall totals
- Extend the chart historically
- Maintain consistency across datasets
Because the data lived directly in the frontend configuration, updates could be made quickly without requiring backend infrastructure changes.
Combining Stacked Bars with Seasonal Totals
One of the key visualization decisions was combining stacked monthly snowfall bars with a total seasonal snowfall line.
The chart configuration used:
seriesType: 'bars',
isStacked: true,
series: {6: {pointSize: 5, type: 'line'}}
This hybrid visualization pattern provided two levels of analysis simultaneously.
The stacked bars showed:
- Monthly snowfall contribution
- Storm distribution throughout the season
- Seasonal pacing trends
The line overlay showed:
- Total snowfall accumulation
- High-performing versus low-performing years
- Relative season strength
This combination made the visualization significantly more useful than a simple bar chart or line graph alone.
Designing for Mobile and Responsive Layouts
One of the most important implementation considerations was ensuring the visualization worked across all screen sizes.
Large data visualizations often become difficult to read on smaller devices due to:
- Compressed legends
- Axis crowding
- Label overlap
- Reduced chart readability
The implementation addressed this by positioning the legend at the bottom with multi-line support:
legend: {
  position: 'bottom',
  maxLines: 2,
}
The chart also automatically re-rendered when the browser resized:
$(window).resize(function () {
  drawVisualization();
});
This ensured the visualization adapted cleanly between desktop, tablet, and mobile layouts without requiring separate chart implementations.
Using Animation to Improve Engagement
The chart included animated rendering on initial page load:
animation: {
  duration: 1000,
  easing: 'linear',
  startup: true
}
This subtle animation served an important UX purpose.
Rather than presenting users with a static wall of data immediately, the animation guided attention through the visualization as snowfall totals built upward across the chart.
This made the experience feel more interactive and polished while improving visual comprehension.
Small interaction details like animation often have an outsized effect on perceived quality and user engagement.
Color Strategy and Seasonal Readability
Each snowfall month was assigned a distinct color:
colors: ['#379d76', '#8178c0', '#fea545', '#006587', '#9aaa4d', '#f6582c', '#dd5182'];Using unique colors improved:
- Month-to-month differentiation
- Visual scanning
- Seasonal comparison speed
- Legend usability
The palette was selected to maintain sufficient contrast while keeping the chart visually balanced and easy to interpret.
For data-heavy interfaces, color assignment becomes a critical usability decision rather than simply a visual styling choice.
Business Impact
The snowfall history visualization quickly became one of the most engaging informational pages on the resort website.
Guests repeatedly returned to compare:
- Current conditions
- Historical storm cycles
- Major snowfall years
- Monthly weather patterns
The experience helped increase engagement by turning operational weather data into interactive storytelling.
From a business perspective, the visualization supported several goals simultaneously:
- Increased on-site engagement
- Stronger seasonal excitement
- Enhanced snow reporting experience
- Improved informational content value
- Higher return visitation to the page
The page also strengthened the resort’s credibility with weather-focused enthusiasts who closely follow snowfall trends and long-term seasonal performance.
Most importantly, the project demonstrated how relatively simple frontend technology can create highly engaging experiences when paired with meaningful data and thoughtful UX design.

Lessons Learned
Data becomes more valuable when visualized clearly: Historical snowfall totals already existed, but visualizing them interactively made the information significantly more engaging and understandable.
Lightweight frontend solutions can drive strong engagement: The project relied entirely on client-side rendering with minimal complexity, yet still delivered a polished and highly trafficked experience.
Responsive visualization design matters: Charts that work well on desktop but fail on mobile quickly lose usability. Designing for responsive behavior upfront dramatically improved accessibility and engagement.
Small UX details improve perceived quality: Animation, color strategy, and legend positioning all contributed to making the experience feel more intuitive and professional.
Conclusion
The snowfall history visualization transformed historical operational data into an engaging digital experience that resonated strongly with Sierra-at-Tahoe’s audience.
By combining Google Charts with responsive frontend design and thoughtful UX decisions, the project created an interactive tool that helped guests better understand snowfall trends across seasons while increasing engagement with the resort’s digital content.
The implementation highlights how effective data visualization can bridge the gap between raw information and meaningful user experience — especially when the subject matter already carries emotional investment and community interest.
For frontend developers and digital marketers alike, the project serves as a reminder that some of the most successful interactive experiences are not necessarily the most technically complex, but the ones that make valuable information easier, faster, and more enjoyable to explore.